• BLOG
    • Sell Your Work
    • Portfolio Submission Guidelines
    • Portfolio Submission Form
    • copyright
    • Medical Shot List
    • Physical Sciences Shot List
    • Social Sciences Shot List
    • Natural Sciences Shot List
    • Medical Portfolio Examples
    • Nature Portfolio Examples
    • Science Portfolio Examples
    • Medical Images
    • Natural History Images
    • Science Photos
    • Vintage Photos & Prints
    • Black History
    • Famous People Photos
    • History of Astronomy
    • History of Computers
    • History of Math
    • Nature Video
    • Science Videos
    • Request an On-Demand Project
    • Artists Overview
    • Emily Ciosek Portfolio
    • Ilusmedical Portfolio
    • Monica Schroeder Portfolio
    • Spencer Sutton Portfolio
    • Evan Oto Portfolio
    • Gwen Shockey Portfolio
    • 3D Illustration
    • Microbiology Illustration
    • Diseases and Conditions
    • Medical Illustration
    • Animals and Creatures Illustrations
    • Nature Illustration
    • 3D Medical Animation
    • Subscribe
    • Contact US
    • Educational Resources
    • Science Photos
    • Rights Managed
    • Royalty Free
    • Pricing
    • Payment Options
    • Clients & Art Buyers
Menu

Science Source | Stock Medical & Science Visual Content

Science and Medical Visual Content Stock Agency
  • BLOG
  • Creators
    • Sell Your Work
    • Portfolio Submission Guidelines
    • Portfolio Submission Form
    • copyright
    • Medical Shot List
    • Physical Sciences Shot List
    • Social Sciences Shot List
    • Natural Sciences Shot List
    • Medical Portfolio Examples
    • Nature Portfolio Examples
    • Science Portfolio Examples
  • Stock Photos
    • Medical Images
    • Natural History Images
    • Science Photos
    • Vintage Photos & Prints
    • Black History
    • Famous People Photos
    • History of Astronomy
    • History of Computers
    • History of Math
    • Nature Video
    • Science Videos
  • Illustration Services
    • Request an On-Demand Project
    • Artists Overview
    • Emily Ciosek Portfolio
    • Ilusmedical Portfolio
    • Monica Schroeder Portfolio
    • Spencer Sutton Portfolio
    • Evan Oto Portfolio
    • Gwen Shockey Portfolio
    • 3D Illustration
    • Microbiology Illustration
    • Diseases and Conditions
    • Medical Illustration
    • Animals and Creatures Illustrations
    • Nature Illustration
    • 3D Medical Animation
  • About
    • Subscribe
    • Contact US
    • Educational Resources
    • Science Photos
    • Rights Managed
    • Royalty Free
    • Pricing
    • Payment Options
    • Clients & Art Buyers

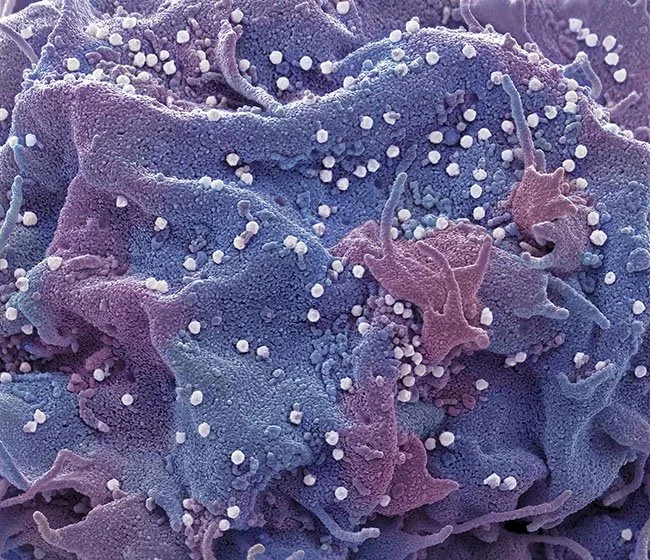
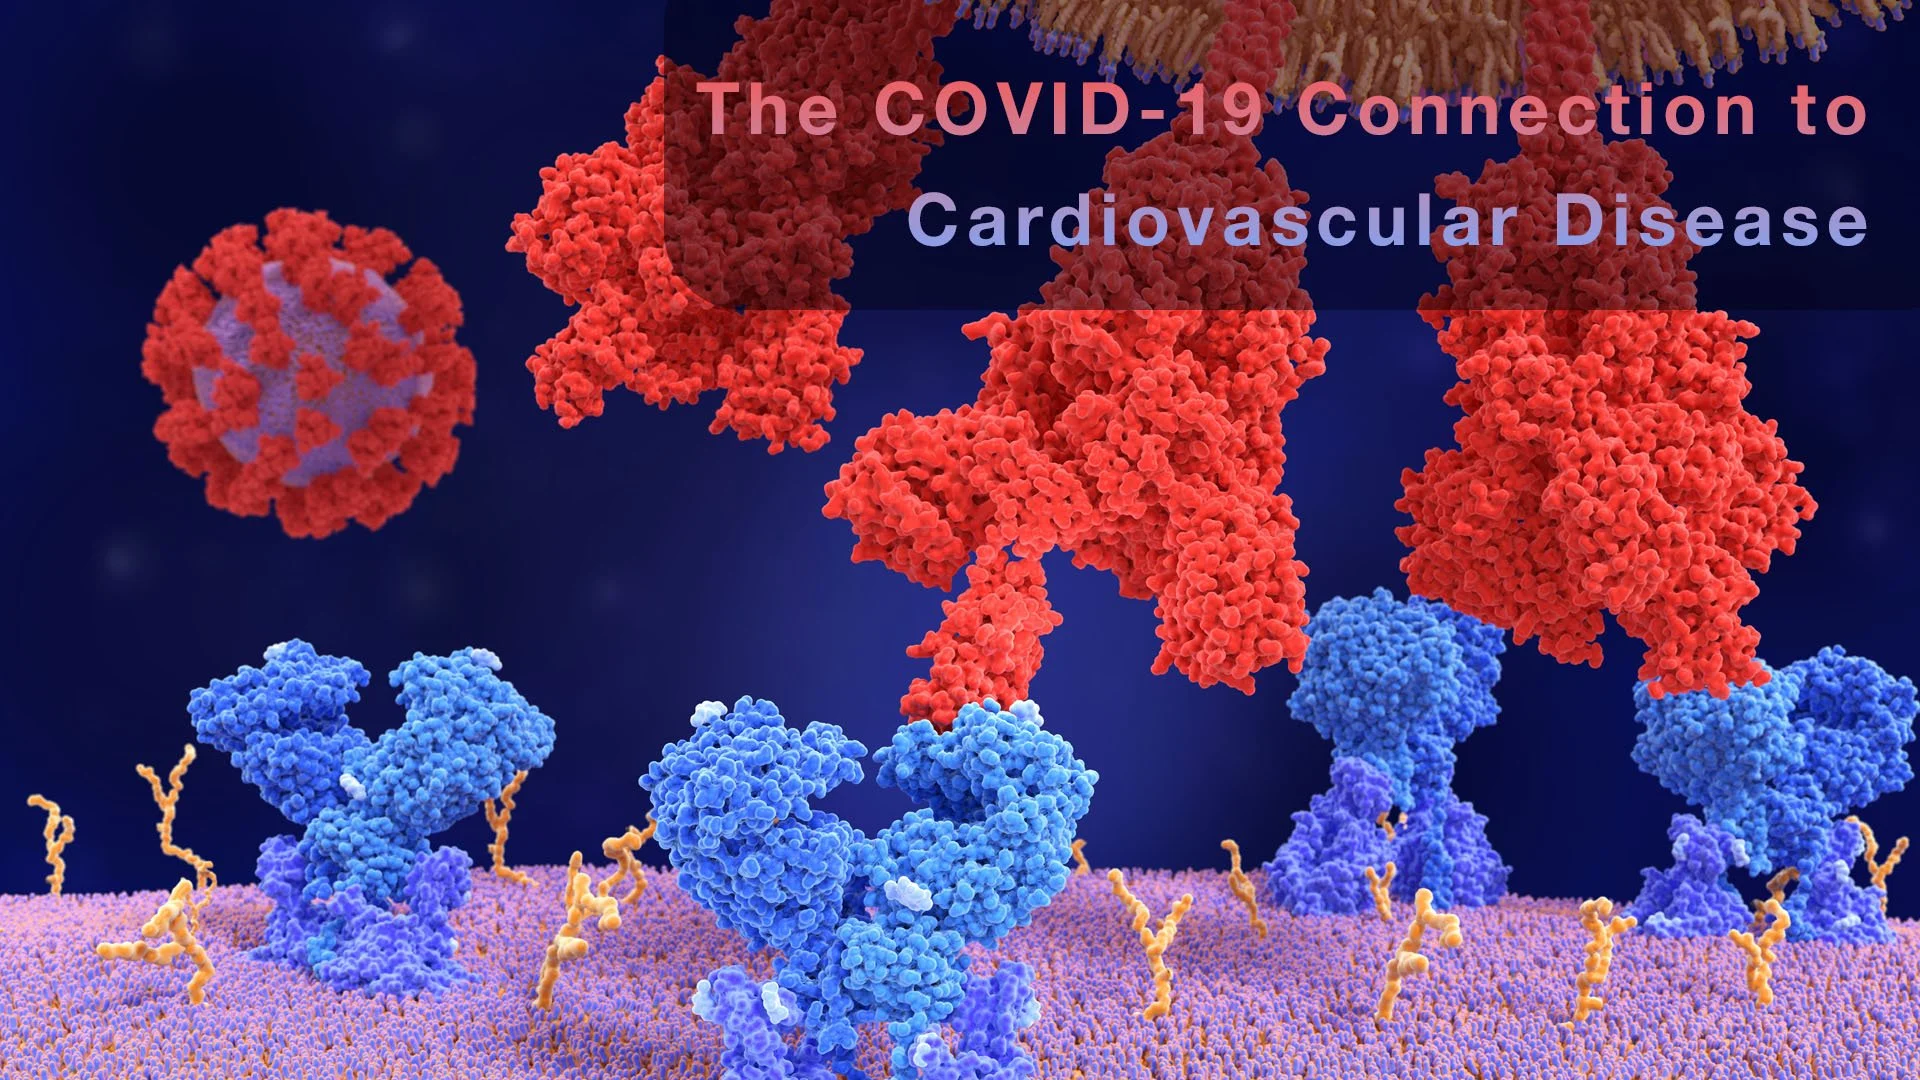
Binding of the coronavirus spike protein to ACE2 receptors mediates the virus penetration into human cells. ©
Juan Gaertner / Science Source

COVID-19 and Cardiovascular Risk

July 8, 2026

Conventional wisdom holds that COVID-19 is a respiratory disease — a virus that colonizes the lungs and, for most patients, stays there. The epidemiological picture emerging several years into the pandemic complicates that view considerably. A substantial and expanding body of population-level research now links SARS-CoV-2 infection to elevated cardiovascular risk: heart attack, stroke, and related vascular events. Persisting well beyond the acute phase of illness. The mechanism, as it turns out, begins not in the lungs but at a single cell-surface receptor.

View our featured gallery: COVID-19 and Cardiovascular Disease →

It Starts With a Receptor, Not the Lungs

The link between SARS-CoV-2 and cardiovascular pathology begins with angiotensin-converting enzyme 2 (ACE2), a protein expressed on the surface of cells throughout the body, where it normally helps regulate blood pressure. ACE2 also happens to be the virus's entry point: the spike protein binds to it with notable specificity, in essentially a lock-and-key fashion.

The lungs draw the most clinical attention because alveolar cells are especially rich in ACE2 and tend to be where infection first becomes symptomatic. But ACE2 is expressed just as prominently on the endothelial cells lining blood vessels throughout the circulatory system — which is precisely what reframes this from a purely respiratory illness into a systemic vascular one.

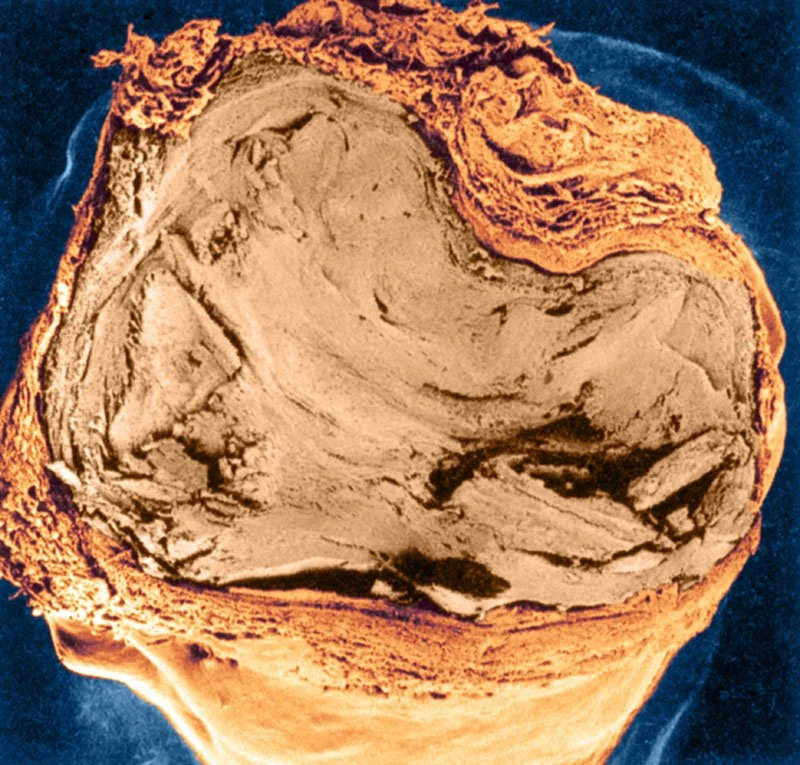
Artery fully blocked, atherosclerosis, scanning electron micrograph. © NYPL / Science Source

A small etymological aside, for anyone who appreciates one: "corona" is Latin for crown, a reference to the ring of spike proteins studding the viral envelope, which under electron microscopy genuinely does resemble a coronet. A fitting name, given how much of the pathology traces back to that structure.

What Happens to Blood Vessels During Infection

Blood vessels are lined by a single layer of cells, the endothelium, which is, remarkably, thinner than a sheet of paper yet performs an outsized physiological role: keeping blood flowing smoothly, regulating clotting, and controlling what passes into surrounding tissue.

When SARS-CoV-2 infects or provokes inflammation in endothelial cells, the resulting condition, endothelial dysfunction, alters vessel behavior in several consequential ways:

  • Increased endothelial "stickiness," raising the likelihood of platelets and clotting factors adhering to vessel walls

  • A broader systemic inflammatory response, which further irritates vascular tissue

  • Disruption of the normal balance between clot formation and clot breakdown

None of this occurs in isolation. It's the underlying reason COVID-19 has been associated with elevated rates of clotting events — not only during acute infection, but for months afterward.

Who's Most at Risk?

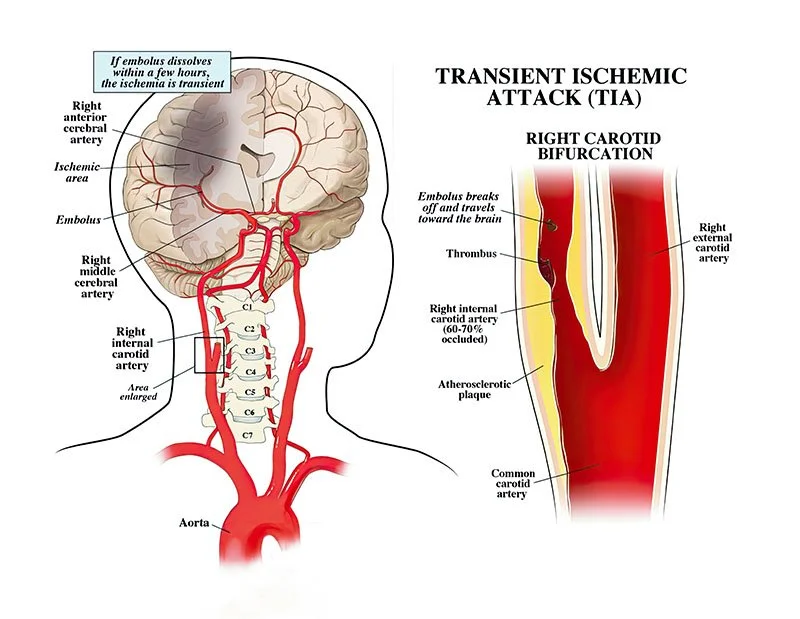
Transient ischemic attack (TIA). © Sue Seif / Science Source

Cardiovascular risk following COVID-19 isn't uniformly distributed across a population. Several well-established factors appear to compound it, and readers with any familiarity with cardiovascular health will recognize most of them immediately:

  • Age: older adults carry elevated risk both during acute infection and in its aftermath.

  • Obesity: independently associated with more severe COVID-19 illness and, separately, with cardiovascular risk generally.

  • Diabetes: a known contributor to vascular damage on its own, which appears to compound COVID-related vascular stress rather than merely coexist with it.

  • Hypertension: among the most frequently observed comorbidities in COVID patients who go on to experience cardiac or cerebrovascular events.

  • Pre-existing cardiovascular disease: a prior heart attack, stroke, or diagnosed cardiac condition raises baseline risk considerably.

  • Smoking: a well-documented contributor to endothelial damage that appears to layer onto, rather than operate independently of, COVID-related vascular effects.

None of these risk factors are unique to COVID-19; they're the same variables that appear in cardiovascular health conversations more broadly. What's notable is how consistently they recur across COVID-cardiovascular research specifically — suggesting the virus may be amplifying existing vulnerabilities rather than introducing an entirely new risk pathway.

Stroke, Heart Attack, and the Long Tail of "Long COVID"

The cardiovascular effects of COVID-19 show up in more than one form, and across more than one timeline.

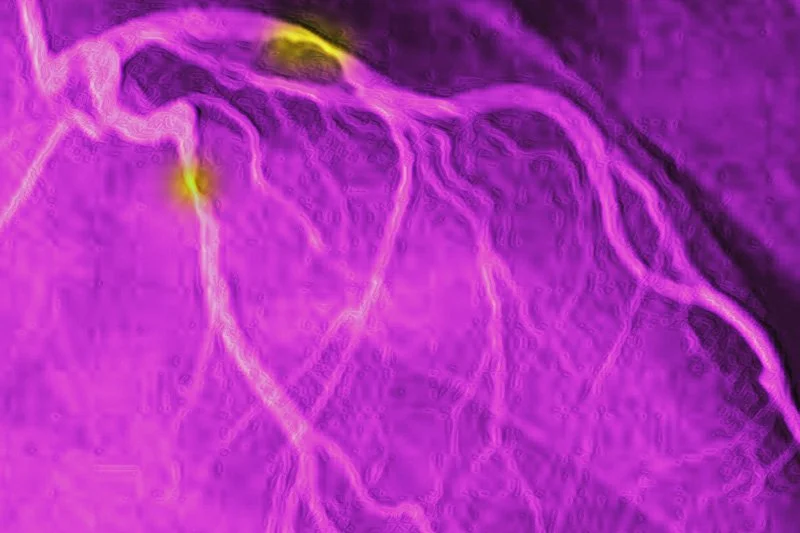
Myocardial infarction: partial destruction of the heart muscle, due stenosis, angiography. © James Cavallini / Science Source

Ischemic stroke — the result of a blood clot obstructing blood flow to the brain — is the subtype most consistently associated with COVID-19, consistent with the virus's broader tendency to promote clotting. Stroke medicine has a well-known saying, "time is brain," reflecting how quickly neural tissue is affected once blood flow is interrupted — part of why any stroke symptoms warrant immediate emergency evaluation.

Cardiac involvement extends well beyond stroke:

  • Heart attack (myocardial infarction): resulting from blocked coronary blood flow, via the same clotting mechanism implicated in ischemic stroke.

  • Myocarditis: inflammation of the heart muscle, reported at elevated rates following SARS-CoV-2 infection.

  • Arrhythmia: irregular heartbeat, another effect linked to post-COVID inflammatory processes.

  • Deep vein thrombosis and pulmonary embolism: clotting conditions affecting the legs and lungs, respectively, both consistent with COVID-19's broader effect on clotting.

Timing is a meaningful variable here. Some events occur during or shortly after acute infection, while hospitalized patients are already under close monitoring. Others manifest considerably later, often discussed under the "long COVID" umbrella, underscoring that cardiovascular risk isn't confined to the acute or most severe phase of illness.

A Story Best Told With the Right Imagery

None of this is visible to the unaided eye: a spike protein engaging a receptor, an inflamed vessel wall, a clot forming inside an artery. That's where strong imagery does what prose can't.

Our collection covers this topic in full: micrographs of clots and damaged endothelium, precise illustrations of stroke and heart attack, and diagnostic imaging of real clinical presentations, all backed by accurate metadata. With more than sixty years sourcing and vetting science and medical imagery, we're also glad to help track down exactly what a piece needs — free of charge, as part of the research support we offer every client.

Browse our COVID-19 and Cardiovascular Disease gallery →

Comment

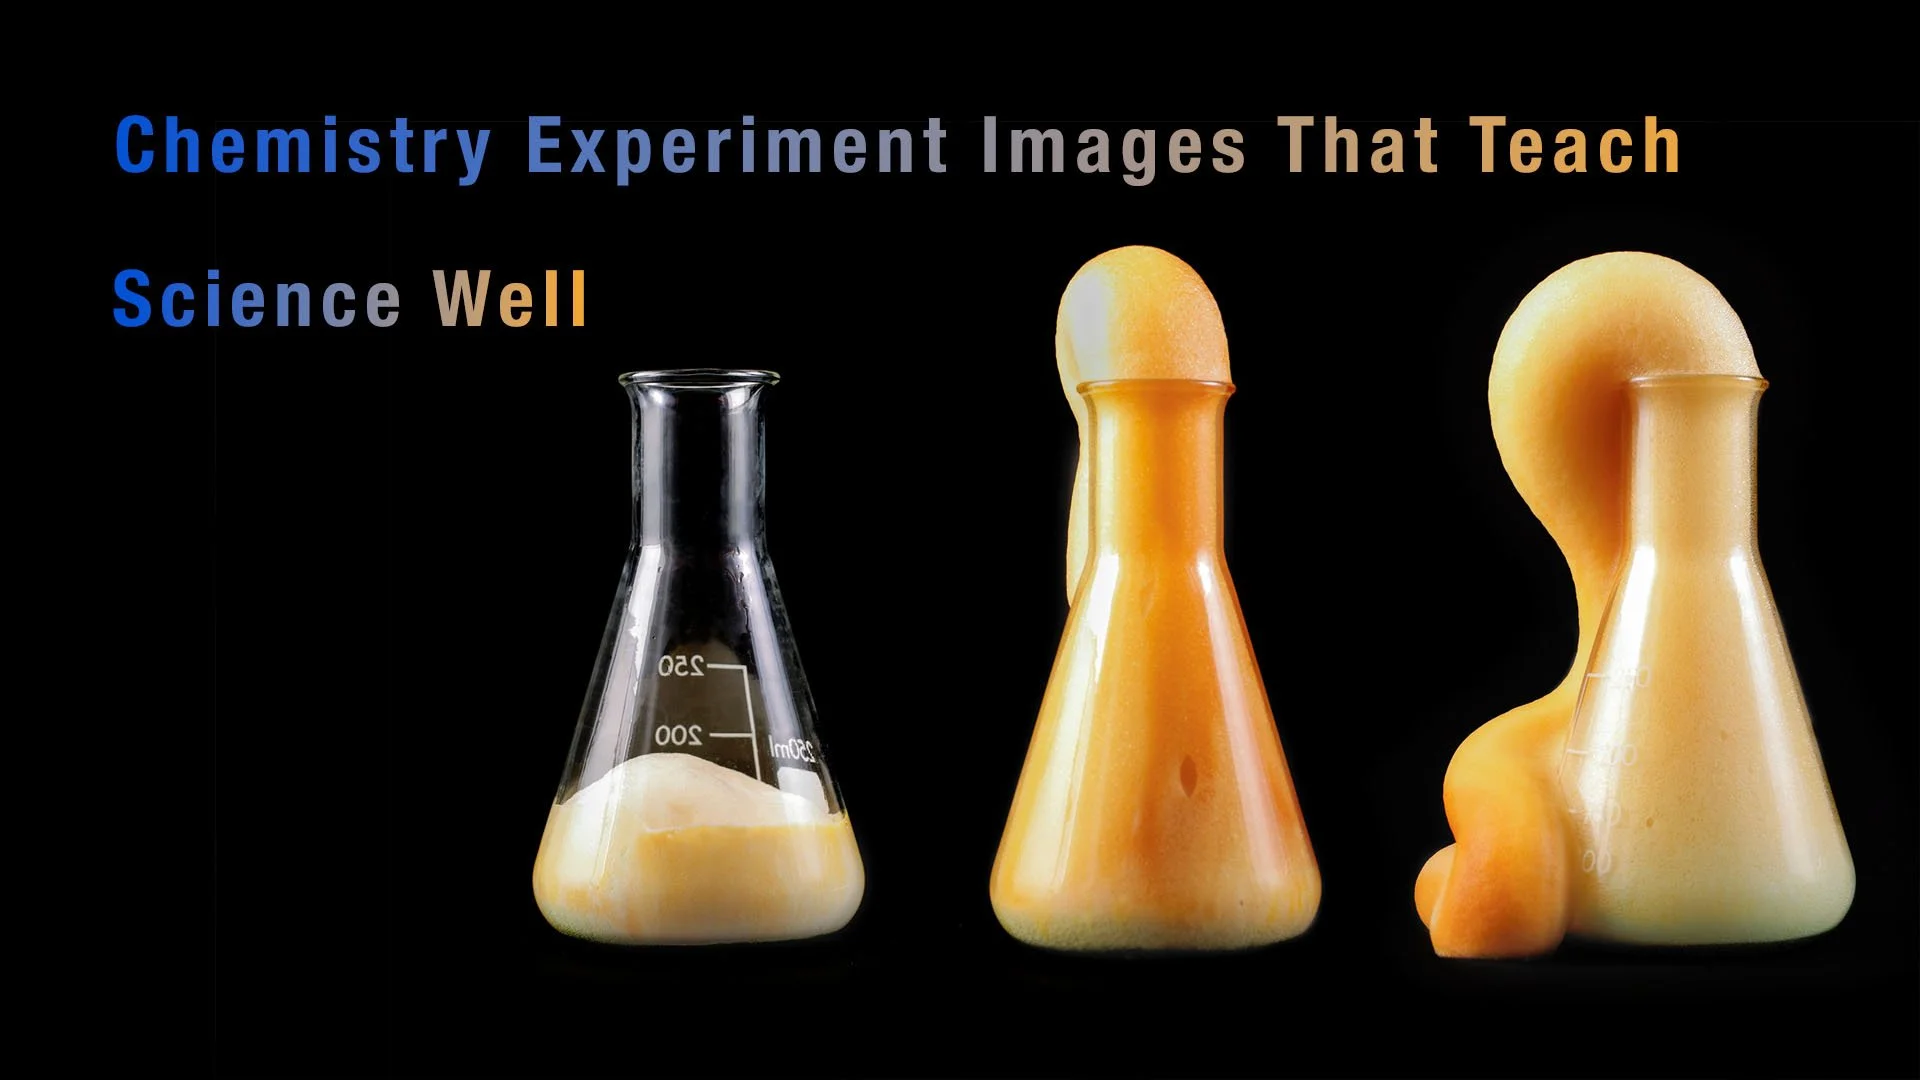
Elephant's toothpaste. A demonstration of the rapid decomposition of hydrogen peroxide. © SPL / Science Source

Chemistry Experiment Images That Teach Science Well

June 30, 2026

Here's something chemistry teachers have known for decades: students remember the day something caught fire. Not the equation on the board, but the magnesium ribbon burning with an intense white light. Not the definition of surface tension, but the paper clip somehow floating on water.

Chemistry is one of the few sciences that can consistently get an audible reaction from an audience. Yet it's also one of the sciences most often illustrated with generic lab photos—a gloved hand holding a flask, a beaker of brightly colored liquid, or a periodic table hanging on the wall. For publishers, that disconnect is a real challenge. The right image doesn't just fill space on a page; it helps explain the science.

Gallery of Stock Chemistry Experiment Images

At Science Source, we've built our collection of chemistry experiments with that goal in mind. A well-chosen photograph can do more than illustrate a reaction—it can help readers understand the underlying principle. In this article, we'll look at some of our most-licensed chemistry experiment images, what makes them effective, and why publishers, educators, and science communicators continue to rely on them.

Classic Chemistry Experiment Photography: Reactions That Teach

Nitrogen triiodide detonating (4 of 4) as a balloon is dropped onto it. © SPL / Science Source

Certain chemistry demonstrations have been classroom favorites for generations because they make invisible chemical principles easy to see. Our high-speed photography captures these reactions in ways that standard lab photography cannot, freezing the split-second moments that help explain what's actually happening. Some of our most frequently licensed images in this category include:

  • Rubidium reacting with water: isolates the ignition moment that makes alkali metals react dramatically, illustrating ionization energy.

  • Nitrogen triiodide explosion: one of the most contact-sensitive reactions in chemistry, captured at high speed.

  • Magnesium ribbon burning: the brilliant white flame of combustion, a classroom classic.

  • Hydrogen balloon exploding: used extensively to illustrate combustion, gas properties, and energy release.

Even simple demonstrations have strong educational value. Reactions such as lemon juice and baking soda, beet juice or red cabbage pH indicators, and the classic vinegar and baking soda experiment are staples of introductory chemistry because they clearly illustrate fundamental concepts. We photograph these experiments with the same attention to scientific accuracy as our more dramatic reaction photography. The color changes are genuine, the reactions are authentic, and the images accurately represent the chemistry taking place.

Crystal Formation, Precipitation, and the Visual Side of Chemistry

Some of our most-licensed chemistry images aren't dramatic reactions at all. Instead, they reveal the structure and behavior of matter in ways that are both scientifically informative and visually striking. For art directors, these images work equally well as compelling visuals and as accurate scientific illustrations.

  • Precipitation of lead iodide — a sudden yellow cloud forming as two clear solutions meet. As close to visual poetry as chemistry gets.

  • Crystal growth in a supersaturated solution — the geometry of matter organizing itself in real time.

  • Iodine crystals sublimating — solid to vapor, with no liquid phase, captured as a still.

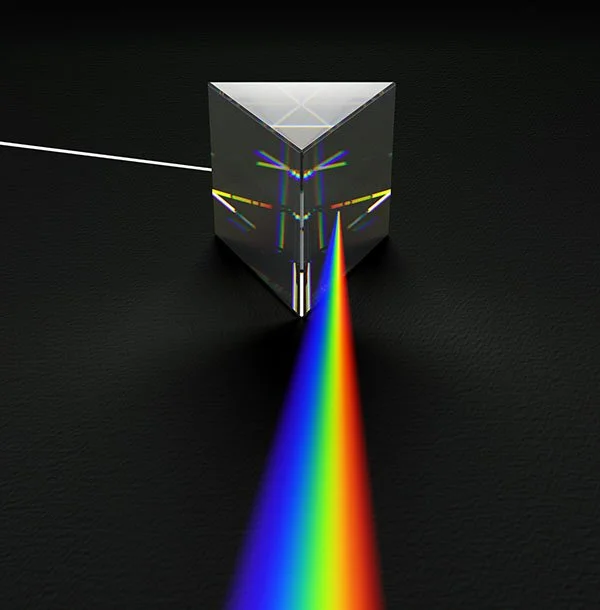
  • Dispersion of white light — the spectrum emerging from a prism, accurate in its wavelength rendering.

  • Food coloring diffusing in water — slow, deliberate, and deeply useful for illustrating diffusion and entropy.

One of the best examples is our surface tension series, including the classic paper clip floating on water and step-by-step photographs of the experiment. It illustrates a concept that seems to defy common sense, using real photography rather than a diagram to show what's happening.

Everyday Chemistry Experiments: Stock Images for Introductory Publishing

Not every chemistry image a publisher needs features bubbling beakers or colorful reactions. Much of our collection focuses on chemistry in everyday life—the science behind familiar materials, foods, household products, and common phenomena. These images are especially useful for introductory textbooks, science journalism, and general-interest publications that want to make chemistry relatable while remaining scientifically accurate.

Denaturation of Protein, Egg Cooking. © Science Source

  • Denaturation of protein through egg cooking — a legitimate biochemistry demonstration in a domestic setting.

  • Boyle's Law with marshmallows in a vacuum — a real experimental demonstration of gas behavior under pressure, not a simplification.

  • Viscosity comparison between liquids — clean, comparative, and immediately useful for physical chemistry contexts.

  • Potato battery — electrochemistry made tangible for younger audiences or introductory publishing.

  • Food science experiment — bridges chemistry and biology for nutrition, health, and consumer science publishers.

Our historical chemistry collection serves a different purpose. Images such as 18th-century engravings of Henry Cavendish's experiments on "factitious air" and illustrations from the 1856 Chemistry of Combustion and Illumination help publishers place modern chemistry in its historical context. They are frequently used in textbooks and articles covering the development of the scientific method, the history of chemistry, and the transition from alchemy to modern chemical science.

Why Scientific Accuracy in Chemistry Stock Photography Matters

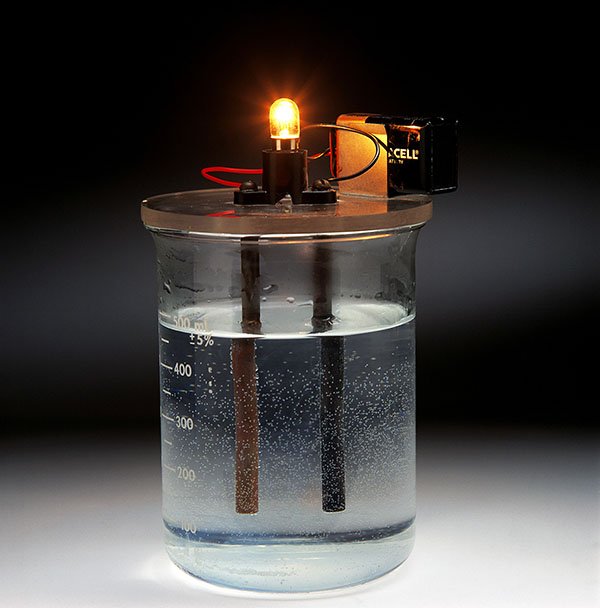
Conductivity. Demonstration of the electrical conductivity of potassium chloride (KCl) solution. © Charles D. Winters / Science Source

Chemistry is one of the disciplines where an inaccurate image can do more than weaken a page—it can mislead the reader. Publishers, educators, and science communicators need visuals that accurately represent the science, not just the look of a laboratory. That means paying attention to details such as:
  • The color of a flame test, which identifies the element being tested.

  • The stage of a reaction being photographed, since timing can affect what the image represents.

  • Laboratory apparatus that reflects an actual experimental setup rather than a stylized prop.

  • Current and correctly assigned chemical hazard pictograms.

Our photographs of Hoffman's apparatus are among our most frequently licensed chemistry images because they accurately depict electrolysis for textbooks, digital learning platforms, and reference publications. The same is true of our series of chemical equilibrium experiments and our hazard pictogram imagery, including potassium dichromate and nickel nitrate.

For picture researchers and art directors, the question isn't simply, "Does this look like chemistry?" It's, "Does it represent the chemistry correctly?" That's where scientifically accurate image collections make a difference.

License Scientifically Accurate Chemistry Images

Many classic chemistry demonstrations remain popular because they clearly illustrate fundamental scientific principles. The iodine clock reaction, for example, is widely used to demonstrate chemical kinetics. After a predictable delay, the solution suddenly turns deep blue, providing a memorable visual example of how reaction rates can be controlled and measured.

The same philosophy guides our chemistry collection. Whether documenting a dramatic reaction, a simple classroom experiment, or historical laboratory equipment, our goal is to provide images that are both visually engaging and scientifically accurate. The collection is used by textbook publishers, educational media, science journalists, and corporate communicators who need chemistry imagery they can trust.
If you're developing a chemistry textbook, educational resource, article, or digital learning platform, we'd be happy to help you find the right images for your project.

Browse Science Stock Image Galleries

Comment

Child with Eczema, model released. © Suzanne Grala / Science Source, Inner elbow of a 2 year old with eczema, model released. © Dr. P. Marazzi / Science Source

Eczema: The Itch That Rewrites Daily Life and the Images That Tell Its Story

June 23, 2026

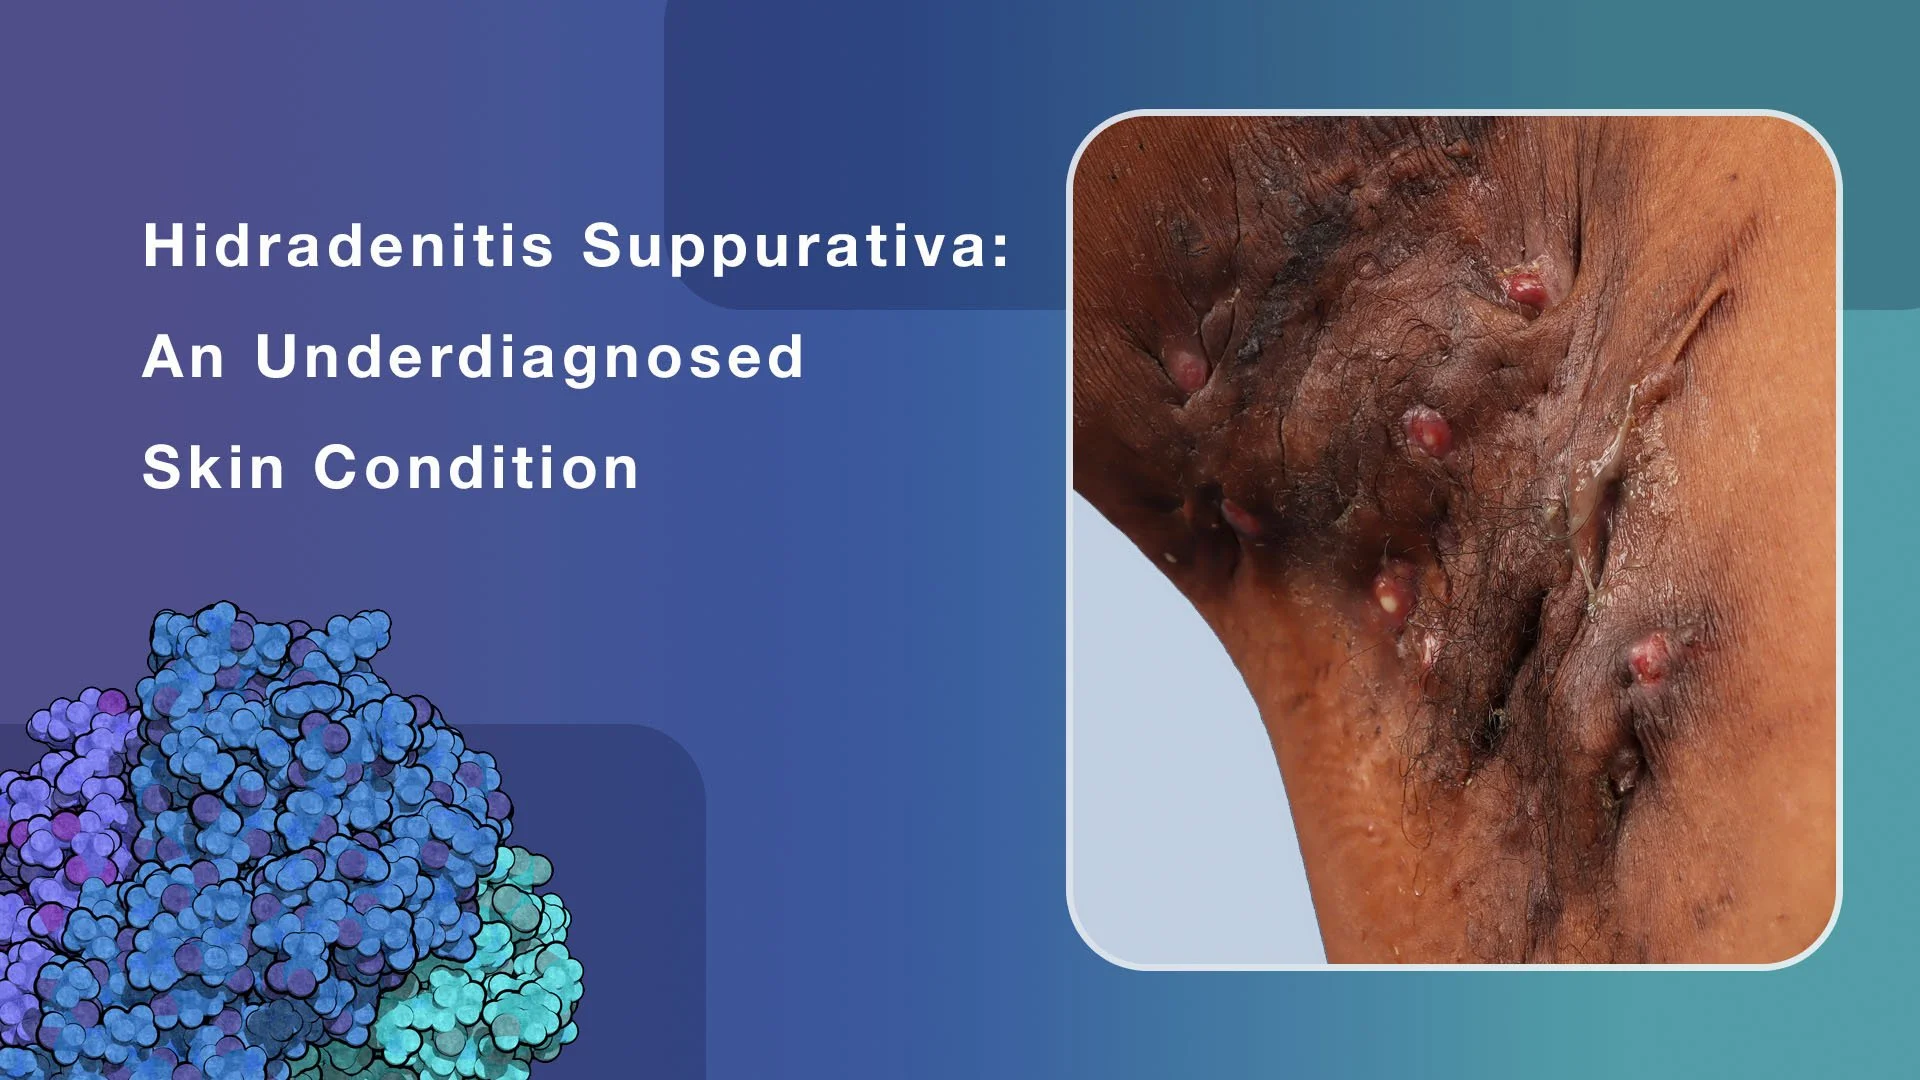
If you've ever watched a baby scratch relentlessly at their own skin, or seen an adult with raw, cracked hands try to explain why they can't simply "stop itching," you already understand something essential about eczema: it is far more disruptive than it looks, and it looks different on everyone. Formally known as atopic dermatitis, eczema affects an estimated 230 million people worldwide — making it one of the most prevalent chronic skin conditions on the planet. And yet, for all its reach, it remains one of the most visually underserved topics in medical publishing. That gap is closing fast, and the demand for accurate, diverse, clinically credible imagery has never been greater.

Eczema — Atopic Dermatitis Stock Images

What Is Eczema? The Short Version

  • Chronic inflammatory skin condition characterized by dry, itchy, inflamed skin that flares and remits over time

  • Not contagious, caused by a combination of genetic, immune, and environmental factors that compromise the skin's barrier function
  • Approximately 50% of cases begin during the first year of life and 85% by age five, but it can develop or persist at any age, including in older adults

  • Affects all skin tones, ages, and body types, but presents very differently depending on skin tone, age, and body location

  • Common presentation sites include the inner elbows, backs of knees, hands, face, neck, and scalp, though it can appear anywhere

  • Part of the "atopic triad": eczema frequently occurs alongside asthma and allergic rhinitis, reflecting its systemic immune roots
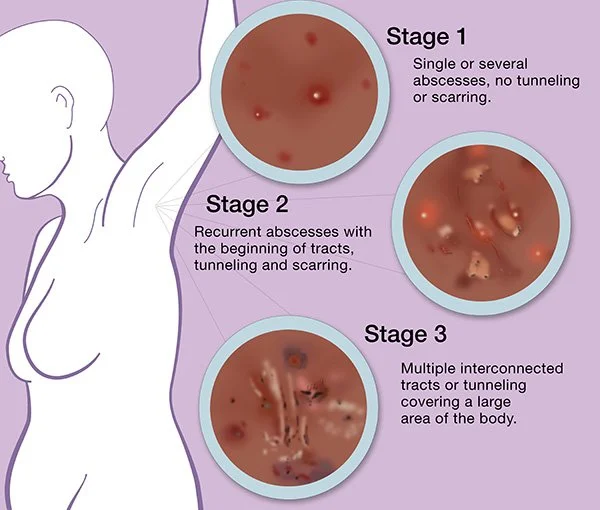

  • Symptoms range from mild dryness and irritation to severe, widespread inflammation that disrupts sleep, work, and quality of life

Eczema in Context: Who Gets It and Why It's Undercovered

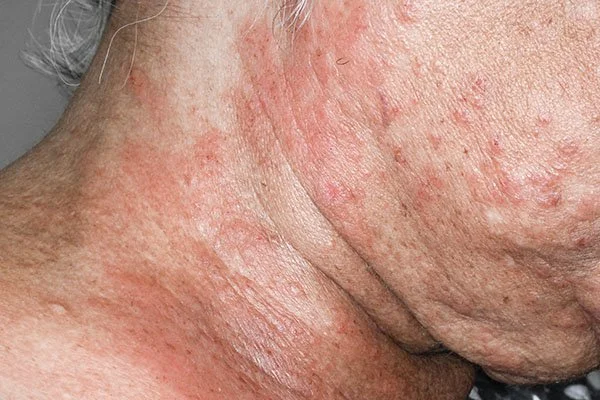
Eczema on the neck of an 89 year old female patient. © Dr. P. Marazzi / Science Source

  • Prevalence rates in the US are estimated at 8% to 18% in children and up to 10% in adults, making it one of the most common conditions a medical publisher will ever need to illustrate

  • Disproportionately affects urban populations and higher-income countries, though the reasons remain an active area of research

  • Despite its prevalence, eczema has been chronically underrepresented in medical imagery, particularly in children and across diverse skin tones

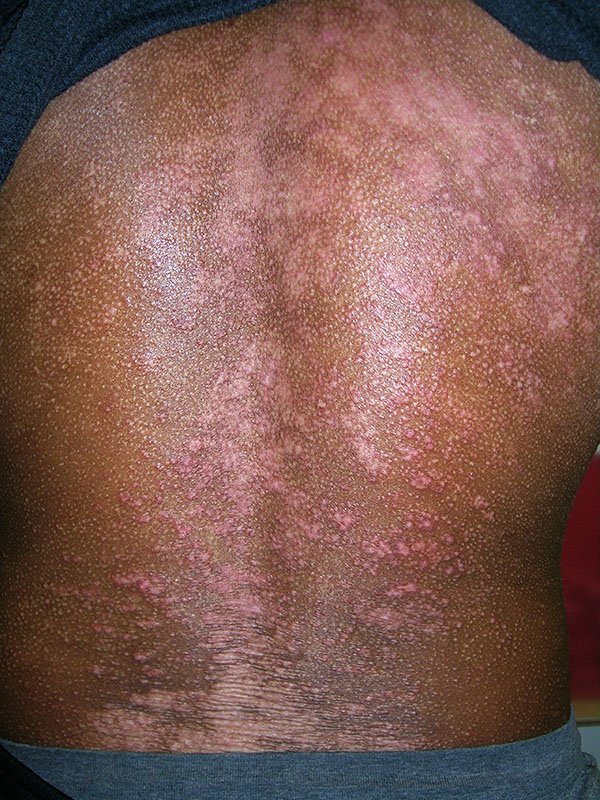
  • On darker skin, eczema may appear brown, violet, or gray rather than the classic red, and lichenification (skin thickening from chronic scratching) can be more pronounced, distinctions that are clinically meaningful and visually distinct

  • Significant stigma around visible skin conditions, combined with the particular sensitivity around photographing infants and children, has historically made quality eczema photography scarce

  • Growing patient advocacy and regulatory pressure for diverse representation in medical education are driving urgent demand for imagery that reflects real patient populations

A Treatment Revolution — Still in Progress

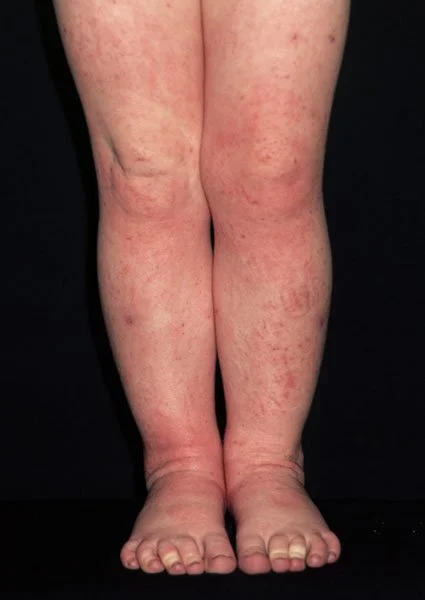
Eczema on a three-year-old girl's legs. © Dr P. Marazzi / Science Source

Eczema was once managed almost exclusively with moisturizers, topical corticosteroids, and broad immunosuppressants that had significant long-term side effects. The past decade has brought a remarkable transformation:

  • Dupilumab (approved 2017) — the first biologic approved for atopic dermatitis, targeting the IL-4 and IL-13 pathways, it changed the standard of care for moderate to severe disease and opened the door to a new era of targeted therapy

  • Lebrikizumab (approved 2024) — an IL-13 inhibitor with a monthly maintenance dosing schedule after an initial loading phase, making it the most convenient long-term biologic option currently available

  • Nemolizumab (approved December 2024) — the first biologic to specifically target IL-31, the key cytokine responsible for the intense itching that is often more debilitating than the visible rash itself

  • JAK inhibitors — oral and topical options (abrocitinib, upadacitinib, ruxolitinib) providing additional pathways for patients who don't respond to biologics

  • Ongoing clinical trials continue to identify new immune targets, making atopic dermatitis one of the most active areas in all of dermatology publishing

Each new approval generates a fresh wave of pharmaceutical communications, patient education materials, continuing medical education content, and journal coverage — all of which require current, accurate, licensable imagery.

Why Accurate Eczema Imagery Matters for Publishers

Atopic dermatitis on the back of a black male patient. © Richard Usatine Md / Science Source

Eczema is deceptively difficult to illustrate well. The condition is highly variable and deeply personal, carrying an emotional weight that generic imagery consistently fails to capture.

Childhood Eczema Gallery

  • Age range is critical: eczema in infants looks nothing like eczema in adults, and pediatric imagery requires particular care around model releases and sensitivity

  • Skin tone diversity is non-negotiable: the clinical presentation differs significantly across skin tones, and educational materials that show only one presentation do a disservice to patients and clinicians alike

  • Body location matters: inner elbows and knees are the classic teaching images, but hands, face, scalp, and eyelids are all common sites with distinct visual and editorial needs

  • Severity spectrum: mild, moderate, and severe presentations serve entirely different publishing contexts, from consumer health magazines to clinical dermatology journals to pharmaceutical approval submissions

  • The itch is invisible: medical illustration plays an essential role in explaining the immune cascade, skin barrier dysfunction, and nerve pathway involvement that drives the itch-scratch cycle; photography alone cannot tell this story

  • Complications require their own imagery: eczema herpeticum (a serious viral complication), infected eczema, and contact dermatitis overlapping with atopic dermatitis all represent distinct clinical scenarios with real publishing demand

What Science Source Brings to the Table

Science Source offers one of the most extensive eczema and atopic dermatitis collections available for licensing, built specifically to serve the needs of medical publishers, pharmaceutical communicators, and healthcare educators.

  • Clinical photography spanning infants, children, and adults — including model-released images across a range of ages, skin tones, and body locations

  • Images documenting mild through severe presentations, including eczema herpeticum and other complications

  • Diverse skin tone representation, including clinical photography on darker skin tones where the condition's presentation differs meaningfully from textbook imagery

  • Medical illustrations explaining skin barrier dysfunction, immune pathway involvement, and the mechanisms targeted by modern biologic therapies

  • A knowledgeable picture research team is available to help you find exactly what your project needs. No obligation

Severe Eczema Clinical Gallery

(Intended for medical, educational, and publishing professionals; images depict significant disease progression)

Whether you're producing a patient education brochure, a pharmaceutical campaign for a new biologic, a pediatric dermatology textbook, or a continuing medical education module, the visual demands of covering eczema are specific, and the stakes for accurate representation are high. Science Source has the depth, the diversity, and the scientific credibility to support that work at every level.

Questions? Our team is here to help. Contact us

Comment

Plaque psoriasis on the elbow — one of the most common presentation sites. Science Source offers clinical photography spanning mild to severe disease, across diverse skin tones and body locations. © Voisin/Phanie / Science Source

A Comprehensive Resource for Psoriasis Visuals

June 19, 2026

For more than 2,500 years, physicians have been trying to understand psoriasis. Ancient Egyptian medical texts described skin conditions that may have been psoriasis. Greek physicians later gave the disease its name, derived from psora, meaning itch. For centuries, psoriasis was confused with other skin disorders, including leprosy, reflecting just how little was known about the condition.

Today, psoriasis is recognized as a chronic immune mediated disease that affects an estimated 125 million people worldwide. Yet despite its prevalence, psoriasis remains widely misunderstood. It is often dismissed as a cosmetic issue when, in reality, it can affect multiple body systems, impact mental health, and significantly reduce quality of life.

As awareness grows and treatment options continue to expand, publishers, healthcare communicators, educators, and pharmaceutical companies need visual content that accurately reflects the many faces of psoriasis. A single image cannot tell the whole story.

What Is Psoriasis?

Psoriasis is a chronic autoimmune disease that causes the immune system to mistakenly accelerate skin cell production. Instead of shedding and renewing over the course of several weeks, skin cells accumulate in just a few days, creating thickened areas of inflamed skin known as plaques.

The condition is not contagious and can affect people of all ages, genders, and ethnic backgrounds.

There are five major forms of psoriasis, each with a distinct appearance:

  • Plaque psoriasis: The most common form, characterized by raised, scaly patches that often appear on the elbows, knees, scalp, and lower back.

  • Guttate psoriasis: Small, drop shaped lesions that frequently develop after infections such as strep throat.

  • Inverse psoriasis: Smooth, inflamed patches found in skin folds, including the underarms and groin.

  • Pustular psoriasis: White pustules surrounded by reddened skin.

  • Erythrodermic psoriasis: A rare but serious form that can affect large areas of the body and may require urgent medical care.

Psoriasis typically follows a cycle of flare ups and periods of remission. Symptoms may improve for months or even years before returning.

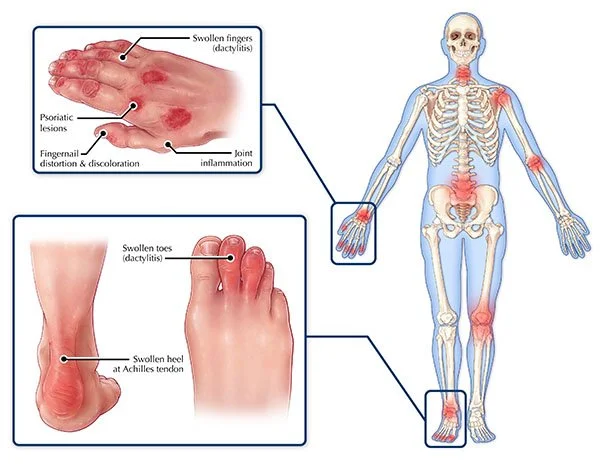
The disease also extends beyond the skin. Up to 30 percent of people with psoriasis develop psoriatic arthritis, an inflammatory joint condition that can cause pain, stiffness, swelling, and long term joint damage. For many patients, psoriasis is a systemic disease rather than simply a skin disorder.

Psoriasis Clinical Photography and Medical Illustration

Psoriasis in Context: Who Gets It and Why It’s Undercovered

Psoriatic arthritis affects far more than the skin. This illustration shows characteristic symptoms, including joint inflammation, nail changes, and dactylitis — the distinctive finger and toe swelling that signals the disease has moved beyond the surface symptoms. © Evan Oto / Science Source

Psoriasis affects an estimated 125 million people worldwide, including about 8 million people in the United States. While it can develop at any age, it is most often diagnosed during two peak periods, in a person’s 20s and again in their 50s.

Despite its prevalence, psoriasis has historically been underrepresented in medical media and educational imagery. Stigma surrounding visible skin conditions can make patients less likely to participate in photography and awareness campaigns. Dermatology photography has also long lacked representation across diverse skin tones, even though psoriasis may appear quite differently on darker skin, often presenting as violet, gray, or brown rather than red.

As publishers, healthcare organizations, and advocacy groups work to address these gaps, demand is growing for more accurate, inclusive, and compassionate visual representation. Better imagery not only reflects the diversity of patients living with psoriasis, it also supports improved education, awareness, and diagnosis.

A New Era of Psoriasis Treatment

The treatment landscape for psoriasis has changed dramatically over the past two decades.

Traditional therapies such as topical corticosteroids, moisturizers, phototherapy, and systemic medications continue to play important roles in treatment. However, advances in immunology have transformed care for many patients with moderate to severe disease.

Biologic therapies have been particularly significant. These injectable medications target specific components of the immune system, including TNF alpha, IL 17, and IL 23 pathways. By focusing on precise immune mechanisms, biologics can dramatically reduce symptoms while improving long term disease management.

Newer oral medications, including JAK inhibitors and other targeted therapies, are providing additional options for patients, especially those with psoriatic arthritis.

For healthcare communicators, this rapid pace of innovation creates a constant need for current, scientifically accurate visual content.

Why Accurate Psoriasis Imagery Matters

Psoriasis presents unique challenges for publishers because there is no single image that represents the condition.

A patient education brochure, a dermatology textbook, a pharmaceutical marketing campaign, and a clinical journal article may all require very different visual approaches.

Skin Tone Representation

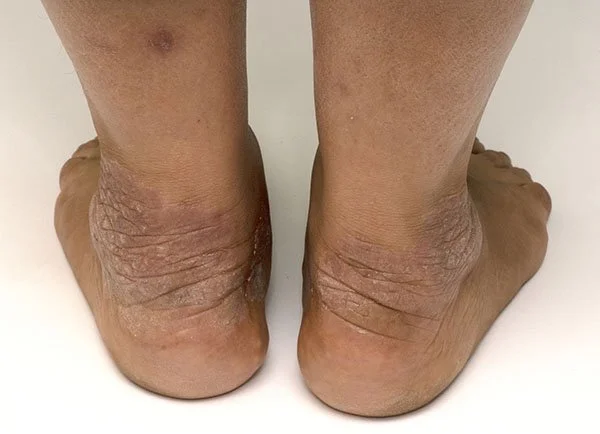
Psoriasis on the ankles of an adult patient. On deeper skin tones, psoriasis may appear violet or brown rather than red — a distinction that makes diverse clinical photography essential for accurate medical education. © SPL / Science Source

Psoriasis can appear differently depending on skin tone. While inflammation often appears red on lighter skin, it may appear violet, gray, brown, or darker than the surrounding skin in people with more melanin. Diverse clinical photography helps ensure that educational materials accurately reflect real patient populations.

Disease Severity

The visual appearance of mild psoriasis differs dramatically from severe disease. Publishers often need imagery spanning a broad spectrum of presentations, from localized plaques to extensive body involvement.

Body Location

Psoriasis affects many areas of the body, including the scalp, nails, hands, feet, face, and skin folds. Different locations create different visual and educational needs.

Psoriatic Arthritis

As awareness grows regarding the systemic nature of psoriasis, demand is increasing for imagery that illustrates joint involvement. Clinical photographs, diagnostic imaging, and anatomical illustrations help tell a more complete story of the disease.

Psoriatic Arthritis Photography and Medical Illustrations

Medical Illustration

Photography alone cannot explain the complex immune processes underlying psoriasis. Medical illustrations remain essential for textbooks, patient education materials, pharmaceutical communications, and scientific publications. Cross sections of skin, immune pathway diagrams, and treatment mechanism illustrations help make complex concepts accessible.

Historical Context

For academic publishing, long form journalism, and documentary projects, historical medical illustrations and archival photography provide valuable context. These materials help trace how understanding and treatment of psoriasis have evolved over time.

A Comprehensive Resource for Psoriasis Visuals

Science Source offers a broad collection of psoriasis and psoriatic arthritis imagery for healthcare, educational, and publishing projects. The collection includes clinical photography across a range of disease severities, body locations, skin tones, and patient demographics, along with diagnostic imaging, medical illustrations, and historical artwork. From patient education materials and clinical journals to pharmaceutical communications and medical textbooks, these visuals help accurately represent the many ways psoriasis affects the body. Science Source provides the depth, diversity, and scientific accuracy needed to tell a more complete story of this complex disease.

Severe Psoriasis: Clinical Image Gallery — These images are intended for medical, educational, and publishing use and depict significant disease progression

Comment

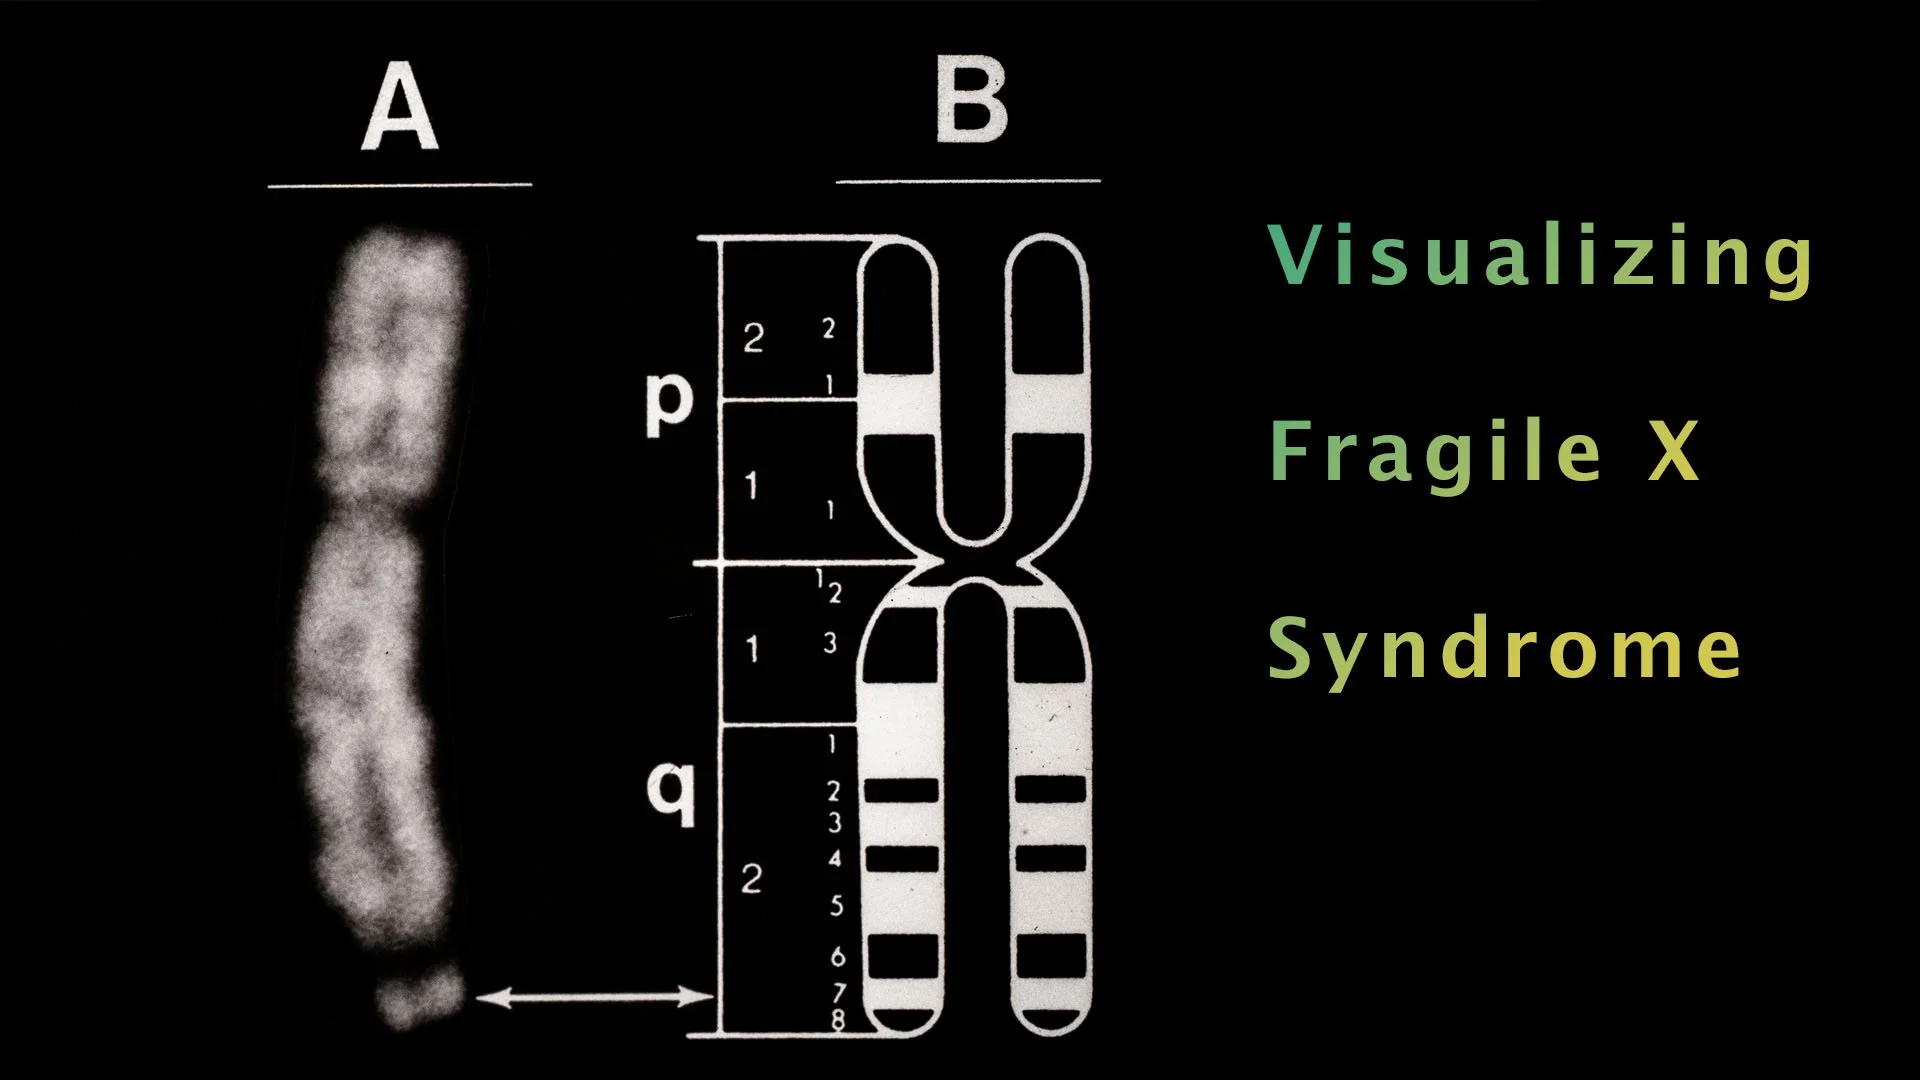
Q-banded human fragile-x chromosome with idiogram. © Richard J. Green / Science Source

Visualizing Fragile X Syndrome

June 16, 2026

Under the microscope, it appears as a thread on the verge of breaking. A narrow constriction near the tip of the X chromosome's long arm. This distinctive chromosomal feature, known as a "fragile site," gave Fragile X syndrome its name and provided one of the earliest visual clues to a disorder that would transform our understanding of genetics, neurodevelopment, and inherited intellectual disability.

Today, Fragile X syndrome remains the most common inherited cause of intellectual disability and one of the most common known single gene causes of autism spectrum disorder. While diagnosis has moved from the cytogenetics laboratory to molecular genetic testing, visual representations of the disorder continue to play a vital role in medical education, scientific publishing, and patient communication.

What Is Fragile X Syndrome?

Fragile X syndrome is an X-linked genetic disorder caused by an expansion of CGG trinucleotide repeats within the FMR1 (Fragile X Messenger Ribonucleoprotein 1) gene on the X chromosome. In unaffected individuals, the gene typically contains fewer than 45 CGG repeats. When the repeat expansion exceeds approximately 200 copies, a full mutation, the gene becomes hypermethylated and transcriptionally silenced.

The loss of FMR1 expression results in a deficiency of fragile X messenger ribonucleoprotein (FMRP), an RNA-binding protein essential for synaptic development, neuronal plasticity, and normal cognitive function. Without sufficient FMRP, neural circuits develop differently, contributing to the cognitive, behavioral, and developmental features associated with the condition.

Fragile X syndrome affects an estimated 1 in 4,000–7,000 males and approximately 1 in 6,000–11,000 females worldwide. Because males possess only one X chromosome, they are generally more severely affected, whereas females often exhibit a broader range of clinical outcomes due to X-chromosome inactivation.

Gallery of Fragile X Syndrome visuals available for licensing.

The Challenge of Visualizing a Variable Disorder

Fragile X syndrome presents with remarkable clinical variability. Some individuals experience mild learning disabilities, while others have significant intellectual impairment, developmental delays, autism spectrum features, anxiety, attention deficits, sensory sensitivities, or social communication challenges.

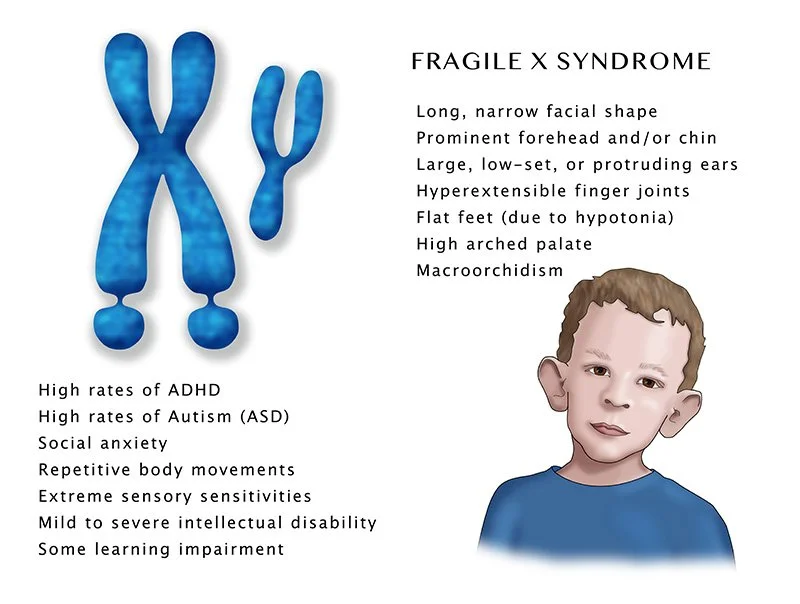
Medical literature frequently describes characteristic physical findings, including an elongated face, prominent ears, a high-arched palate, and, after puberty in males, macroorchidism. Yet no single photograph can fully represent the diversity of people living with Fragile X syndrome.

Fragile X Phenotype

A medical illustration describing common physical and cognitive traits. © Monica Schroeder / Science Source

More Information

This variability highlights the importance of scientifically accurate medical illustrations, infographics, and educational graphics. Well-designed visuals can communicate core clinical and genetic concepts without implying that every individual shares the same appearance or experiences the same symptoms.

From Cytogenetics to Molecular Genetics

The syndrome's name originates from a striking cytogenetic observation. When cells were cultured under specific laboratory conditions, researchers observed a constriction or apparent break at Xq27.3, the chromosomal location of the FMR1 gene. For many years, identifying this fragile site was an important diagnostic technique.

Today, molecular testing has largely replaced cytogenetic methods. DNA based assays can determine CGG repeat number, identify methylation patterns, and distinguish between normal, intermediate, premutation, and full-mutation alleles with far greater accuracy.

As diagnostic technologies have evolved, so too have the images used to explain the disorder. Contemporary educational materials increasingly rely on molecular diagrams, chromosome illustrations, gene maps, repeat-expansion graphics, and pathway based visualizations that help readers understand the underlying biology.

Why High-Quality Fragile X Visuals Matter

Chromsome Map

An illustration showing the location of the FMR1 gene on a human chromosome. © Monica Schroeder / Science Source

More Information

For publishers, educators, and healthcare communicators, Fragile X syndrome presents a unique visual challenge: conveying complex genetic mechanisms while accurately representing a highly variable human condition.

Medical textbooks require imagery that reflects current scientific understanding. Continuing education materials benefit from graphics that clarify inheritance patterns and molecular mechanisms. Genetic counseling resources rely on visuals that make abstract genomic concepts more accessible to patients and families.

The most effective imagery does more than illustrate a diagnosis. It provides context, communicates scientific accuracy, and supports learning without oversimplification or sensationalism.

Sourcing Scientifically Accurate Fragile X Syndrome Imagery

When selecting visual content, accuracy should extend beyond aesthetics. Chromosomal diagrams should correctly identify the FMR1 locus at Xq27.3. Molecular illustrations should accurately depict CGG repeat expansion and gene silencing. Clinical imagery should be accompanied by an appropriate context that reflects the condition's broad phenotypic spectrum.

For scientific publishers, healthcare organizations, and educational institutions, the professionally curated stock imagery at Science Source offers an efficient alternative to unverified online sources. Carefully reviewed medical illustrations, infographics, and research-based visual assets help ensure consistency, accuracy, and compliance with publication standards.

As our understanding of Fragile X syndrome continues to evolve, the need for precise, evidence-based visual communication grows alongside it. Whether illustrating a chromosome, a molecular pathway, or the lived experience of affected individuals, high-quality imagery remains an essential tool for translating complex genetics into meaningful understanding.

Comment

Grace Hopper and the First Computer Bug: A Legendary Legacy

June 10, 2026

Did you know that the first instance of “debugging” a computer involved an actual insect? In 1947, engineers working on the Mark II computer at Harvard University discovered a moth trapped in a relay, causing a malfunction. Grace Hopper, a pioneering computer scientist, recorded the incident in the logbook—coining the now-famous term “debugging.” Ever since, “debugging” has become a standard part of computer science vocabulary.

Grace Hopper, affectionately known as “Amazing Grace,” achieved numerous milestones in computer science. She was the first to use a compiler to translate English into computer code, making programming more accessible. Hopper invented COBOL, one of the first and most influential programming languages still in use today, and she played a key role in developing the UNIVAC—the first commercially produced computer designed for business and data processing.

Gallery of Grace Hopper Images

Hopper’s academic journey was equally impressive. She earned her Ph.D. in mathematics and mathematical physics from Yale University and taught at Vassar College. During World War II, she sought to join the WAVES, the women’s branch of the U.S. Naval Reserve. Though her mathematical talents were deemed too valuable for typical service, she was granted a special commission and assigned to the Bureau of Ships Computation Project at Harvard as a lieutenant, junior grade.

Grace Hopper’s distinguished career continued for decades. She finally retired at the age of 79 as a Rear Admiral, making her the oldest active-duty officer in the U.S. Navy at the time. Her groundbreaking work was recognized with many honors, including the Presidential Medal of Freedom.

From the first computer “bug” to revolutionizing how we communicate with machines, Grace Hopper’s legacy continues to inspire generations of scientists, engineers, and innovators.

ScienceSource.com is here to provide you with the visual resources you need for your science communication. Whether it’s historical or cutting-edge, we’re here for you.

Comment

CAR T-cell therapy, micrograph (SEM) of a T-cell (orange) and a breast cancer cell (blue) © Steve Gschmeissner /Science Source

CAR T-Cell Therapy: Engineering the Immune System to Fight Cancer

April 7, 2026

What if your own immune cells could be trained to recognize and destroy cancer?

This is no longer a futuristic idea—it’s happening right now.

In 2017, the U.S. Food and Drug Administration approved CAR T-cell therapy, a groundbreaking treatment often described as a “living drug.” Since then, more than 35,000 patients have received it, offering new hope where traditional therapies have failed.

GALLERY OF CAR T-CELL THERAPY IMAGES

How It Works

Diagram of the (CAR) T-cell Therapy Process

A diagrammatic illustration of chimeric antigen receptor (CAR) T-cell therapy. The process begins with the extraction of blood from the patient. Through leukapheresis, T-cells are isolated. © Monica Schroeder / Science Source

View Preview

CAR T-cell therapy harnesses the power of your immune system in a highly personalized way:

First, doctors collect a blood sample and isolate T-cells—white blood cells that play a central role in immune defense. In the lab, these cells are genetically modified to produce Chimeric Antigen Receptors (CARs), which allow them to recognize specific cancer cells.

Once reprogrammed, the cells are multiplied and infused back into the patient’s body. From there, they actively seek out and destroy cancer cells with precision.

A Targeted Approach

A cancer patient's own blood is drawn, modified in a lab, and returned weeks later as a living treatment. It sounds like something out of a near-future film. It's actually standard practice at cancer centers around the world, and it's been since 2017, when the FDA approved the first chimeric antigen receptor (CAR) T-cell therapy, tisagenlecleucel, for a form of pediatric leukemia.

Today there are seven FDA-approved CAR T-cell therapies on the market, covering several types of leukemia, lymphoma, and multiple myeloma. For publishers covering oncology, immunology, or biotechnology, it's one of the more visually compelling stories in modern medicine — and one that depends heavily on good imagery to explain, since the mechanism is almost entirely invisible to the naked eye.

What CAR T-Cell Therapy Actually Does

The "CAR" in CAR T-cell therapy stands for chimeric antigen receptor — chimeric meaning made of parts from different sources, much like the mythological chimera that lent the term its name. That's a fitting description, because the receptor itself is an engineered hybrid: part antibody, part T-cell signaling machinery, stitched together to give an ordinary immune cell a new and very specific job.

The process starts with leukapheresis, a procedure that filters T-cells out of a patient's blood. Those T-cells are sent to a lab, where a disarmed virus is used to insert the gene for the CAR into the cell's DNA. The receptor that results is built to recognize a particular protein on the surface of cancer cells — CD19 on many leukemias and lymphomas, BCMA on multiple myeloma. Once the modified cells are grown into the millions and infused back into the patient, they circulate through the body, latch onto cancer cells displaying that target protein, and trigger their destruction.

It's worth noting how different this is from chemotherapy, which works by killing rapidly dividing cells broadly, healthy and cancerous alike. CAR T-cells are trained for one target. That precision is the whole point, and it's also why the therapy is often called a "living drug" — it isn't a compound that clears the body in hours, but a population of cells that can persist and keep working for years.

A Surprisingly Durable Effect


Chimeric antigen receptor (CAR) therapy.

Engineered receptor (light blue) on the surface of a T-lymphocyte bind specifically to CD19-antigen molecules (red) on a leukemia cell. © Juan Gaertner / Science Source

View Preview

One of the more striking findings to come out of long-term CAR T-cell follow-up studies is just how durable remission can be. Patients in some of the earliest trials, treated more than a decade ago, still have detectable CAR T-cells circulating in their blood and remain cancer-free. That kind of staying power was not a given — many immune therapies fade over time as the engineered cells die off or the body clears them.

Researchers are still working out why some patients respond this way and others don't, which has made CAR T-cell biology one of the more active corners of cancer research. It also explains why this therapy, originally developed for blood cancers, is now being tested far beyond them — in early trials for solid tumors such as glioblastoma and pancreatic cancer, and even in autoimmune diseases like lupus, where the same "seek and destroy" logic is being redirected at malfunctioning immune cells rather than cancer cells.

Why This Story Is Hard to Tell Without the Right Images

CAR T-cell therapy is a genuinely difficult subject to illustrate. There's no tumor to photograph shrinking on a scan, no visible wound, no obvious before-and-after. The actual event being described — a re-engineered T-cell recognizing and binding to a cancer cell — happens at a scale measured in microns. For editors and writers working on this topic, that creates a real gap between the science and what a reader can see.

T-cells Surrounding an Apoptotic Hela Cervical Cancer Cell.

Scanning electron micrograph (SEM) of T-cells (small round) and an apoptotic cervical cancer cell (HeLa). T-cells are a component of the body's immune system. © Steve Gschmeissner / Science Source

View Preview

This is where electron micrographs and medical illustration do work that prose alone can't. A scanning electron micrograph showing a T-cell physically attached to a cancer cell makes the abstract idea of "targeted immune attack" concrete in a way no diagram of arrows and labels really can. A well-rendered 3D illustration of the receptor itself helps readers understand that a CAR isn't a drug in the traditional sense, but a piece of engineered molecular architecture sitting on the surface of a living cell.

Because this is a fast-moving field — new approvals, new targets, expansion into solid tumors and autoimmune disease — publishers also need imagery that won't read as dated or oversimplified next to the current science. Generic "cells under a microscope" stock photography tends to flatten a nuanced mechanism into something generic. Accurate labeling, correct cell morphology, and captions that reflect current terminology matter more here than in most science topics, simply because so few readers (or writers) have a strong mental picture of what a T-cell or a chimeric receptor actually looks like to begin with.

A Field Still Being Written

CAR T-cell therapy isn't a finished story. New CAR designs are in trials that aim to reduce side effects like cytokine release syndrome, "off-the-shelf" allogeneic versions are in development to make treatment faster and cheaper, and researchers are racing to crack the solid-tumor problem that has so far limited this approach mostly to blood cancers. Each of those threads will need its own visual vocabulary as the science evolves — which is part of why an imagery collection in this space needs to be maintained as carefully as the science itself.

GALLERY OF CAR T-CELL THERAPY IMAGES

Comment

Professor Marie Curie in her laboratory at the University of Paris, Radium Institute. © Science Source

How Marie Curie Saved Lives, Women's History Month

March 20, 2026

She Developed Mobile X-Rays to Save Lives in World War I

When people think of Marie Curie, they often think of her Nobel Prize–winning discoveries in radioactivity. But one of her most impactful contributions came during World War I, when she helped bring X-ray imaging directly to the battlefield.

At the time, doctors struggled to locate bullets and shrapnel in wounded soldiers. Surgery was often slow, imprecise, and life-threatening.

Curie changed that.

GALLERY OF MARIE CURIE STOCK HISTORY CONTENT

She developed mobile radiography units— later known as “Little Curies”—that could travel to field hospitals. These vehicles allowed doctors to see inside the body in real time, dramatically improving treatment and survival rates.

A Mother and Daughter on the Front Lines

Curie’s work became a family mission. Her daughter, Irène Joliot-Curie, joined her in operating the X-ray units and training others.

Together, they established radiology programs, equipped over 200 units, and trained technicians—many of them women—to use this new technology under wartime conditions.

It’s estimated that more than a million soldiers benefited from these mobile X-ray services.

A Lasting Medical Legacy

Today, X-ray imaging is a standard diagnostic tool around the world. Curie’s wartime innovation helped transform it from a scientific discovery into a practical, life-saving medical technology.

Her legacy is not only in what she discovered—but in how she applied science to save lives.

Explore the Story Through Visual History

At Science Source, we offer a vast collection of scientific, medical, and historical stock imagery that brings stories like this to life. From early radiology equipment to archival images of wartime medicine, our collection helps educators, publishers, and creators illustrate the human impact of scientific breakthroughs.

Explore our history collection to discover powerful visuals that connect science, medicine, and real-world events.


World War I French field hospital locating bullet with x-ray machine.

During World War I, Marie Curie developed mobile radiography units, called Little Curies, to provide X-ray services to field hospitals. Stereograph, Keystone View Company, c. 1915. ©Science Source

View Preview

A Petite Curie, Marie Curie's Mobile X-ray Unit.

Marie Curie developed mobile radiography units, called Petite (Little) Curies, to provide X-ray services to field hospitals © Science Source

View Preview

Marie Curie and Her Daughter, Irene.

Irene and Marie Curie operating a mobile X-ray machine at Hoogstade Hospital in Belgium in 1915, during World War I. Together, they trained numerous technicians and saved the lives of thousands of injured soldiers. © Science Source

View Preview
Comment

3D illustration showing active brain and energetic vagus nerve. © Axel Kock / Science Source

The Vagus Nerve: Hype, Science, and Clinical Reality

February 26, 2026

The vagus nerve has recently become a popular topic in wellness media and social platforms, often promoted as a newly discovered key to health and longevity. But what is the vagus nerve, and what does medical science actually say about its role in human health?

The brain contains 12 pairs of cranial nerves, which emerge directly from the brain and brainstem. Most cranial nerves serve sensory or motor functions in the head and neck such as vision, hearing, smell, and facial movement. The vagus nerve is different.

GALLERY OF VAGUS NERVE STOCK IMAGES

Extending from the brainstem into the chest and abdomen, the vagus nerve plays a central role in regulating the autonomic nervous system (ANS). This system controls involuntary body functions such as:

  • Heart rate

  • Breathing

  • Blood pressure

  • Digestion, including enzyme secretion and peristalsis

  • Communication between the gut and brain

The autonomic nervous system has two primary branches:

  • The sympathetic nervous system (SNS), often described as the “fight-or-flight” response

  • The parasympathetic nervous system (PNS), which supports “rest-and-digest” functions

The vagus nerve is the primary driver of parasympathetic activity, helping maintain internal balance, or homeostasis.

Vagus Nerve Stimulation: Evidence-Based Applications

Despite sweeping wellness claims suggesting vagus nerve stimulation (VNS) is a cure-all, clinical applications are more limited.

Physicians have used implantable vagus nerve stimulators, devices similar in appearance to cardiac pacemakers, for decades. These devices deliver controlled electrical impulses to the nerve and are typically prescribed when conventional treatments have proven insufficient.

Currently, VNS therapy is most commonly used for:

  • Drug-resistant epilepsy

  • Treatment-resistant depression

  • Stroke rehabilitation support

Ongoing research continues to explore its broader therapeutic potential, but its clinical use remains carefully regulated and condition-specific.

Medical Imaging for Emerging Therapies

As conversations around neuromodulation and autonomic regulation continue to grow, access to accurate, high-quality medical imagery is essential for educators, publishers, and healthcare communicators.

Science Source offers extensive medical and scientific stock photography—from traditional healthcare procedures to advanced treatments, including implantable vagus nerve stimulators and neurological therapies. Flexible licensing options, including subscriptions, are available to meet editorial and commercial needs.

X-ray, Vagus Nerve Stimulator

Chest X-ray showing a vagus nerve stimulator for epilepsy. © Scott Camazine / Science Source

View Stock Image

Cranial Nerves, Medical Illustration

The brain from an inferior (basal) view showing the twelve pairs of cranial nerves. © Evan Oto / Science Source

View Stock Image

Autonomic Nervous System

Medical illustration showing the effects of the autonomic nervous system on the internal organs. Both sympathetic and parasympathetic. © PIKOVIT / Science Source

View Stock Image
Comment
aurora borealis, yukon, canada

Aurora Borealis, Yukon, Canada. © Joseph Bradley / Science Source

The Cycles of Life, Science, and Nature

December 30, 2025

A blog celebrating the the many cycles in life, nature, science, and nature.

Read More
Comment

Measles virus particle, illustration. © Kateryna Kon / Science Source

The Science of the Measles

October 22, 2025

The first written description of measles appeared in the 9th century, recorded by Persian physician Muhammad ibn Zakariya al-Razi.

This highly contagious viral infection originated from a mutation of a bovine disease called rinderpest. Through global vaccination efforts, rinderpest was eradicated in 2011.

While cattle are now safe, humans remain vulnerable to the measles virus.

With global travel, measles spread rapidly across continents, leaving illness and death in its wake.

GALLERY OF MEASLES STOCK IMAGES

Those infected typically develop a high fever, cold-like symptoms, and a rash. Most recover within a few weeks, but some develop pneumonia or encephalitis. Pregnant women face the risk of severe complications, including harm to their unborn child.

The worst U.S. outbreak occurred before the vaccine was developed, causing nearly 500 deaths and over half a million infections.

The measles vaccine, developed in 1963 and widely available by 1971, is 97% effective. Yet some still put children—and others—at risk by avoiding vaccination. Even a mild case can transmit the virus to infants, older adults, or those with weakened immune systems, leading to serious illness or death.

In rare cases, measles can lead to a fatal complication known as subacute sclerosing panencephalitis (SSPE).

Everyone has the choice to vaccinate, but it’s vital that decisions are based on accurate medical information.

Science Source provides authentic medical imagery, illustrations, and infographics to support your healthcare communication projects.

Measles Illustration

Symptoms, complications and infections rate. © Monica Schroeder / Science Source

Image Preview

Baby with Measles Rash

A baby infected with the Morbillivirus, the cause of measles, or rubeola. © Betty Partin / Science Source

View Preview

TEM of Measles (rubeola) Virus

Colored transmission electron micrograph (TEM) of a measles virus (rubeola), with its envelope broken exposing the nucleocapsid filaments. © Dr. Linda Stannard / Science Source

View Preview

Rinderpest Plague, 1868

Cattle dying in the slaughterhouse yards, during the cattle plague. Measles developed from a mutation of the rinderpest virus. © NLM / Science Source

View Preview
Comment

Spinosaurus aegyptiacus in its paleo-environment: North Africa (Egypt) around 95 million years ago. This Spinosaurus is a male in its breeding colouration; we can see this from the brightly colored throat and the yellow blotches on the sail. This male is patrolling its territory in search of a potential partner. © Simone Zoccante / Science Source

New Paleoartists Bring the Prehistoric World to Life: Simone Zoccante, Mohamad Haghani and Gustavo Higón

September 26, 2025

Science Source is excited to welcome three new paleoartists—Simone Zoccante, Gustavo Higón, and Mohamad Haghani to our collection. Each brings prehistoric creatures to life while recreating Earth’s ancient landscapes with the latest scientific insights.

Simone Zoccante, an Italian artist with nearly a decade of experience, has become a leading figure in contemporary paleoart. His crisp, highly detailed digital style merges scientific accuracy with a striking modern look. Featured here is his Spinosaurus, a dinosaur built for aquatic hunting, with a crocodile-like tail for propulsion, dense bones that kept it submerged, and a sail that may have aided swimming or served as display. Altogether, these traits made it one of the best swimmers of land-dwelling dinosaurs.

Gallery of Stock Image Paleo Art Content

Computer illustration depicting an adult Dakotaraptor steini. © Gustavo Higón/Science Source

Gustavo Higón, based in Spain, is known for his cinematic paleoart. His illustrations often place dinosaurs in stark, desert environments, capturing both their power and fragility. His illustration of an adult Dakotaraptor steini in full stride shows one of the largest raptors —over 16 feet long, feathered, and built for speed. The scene emphasizes its anatomy and locomotion, illustrating how this predator hunted and explored its ecosystem.

Two Elasmosauruses swimming through the water, chasing and preying upon schools of fish in a dynamic underwater scene. © Mohamad Haghani / Science Source

Mohamad Haghani, from Iran, has been working in paleoart for nearly ten years. Combining detailed anatomy with carefully reconstructed environments, Haghani conveys the most current scientific research with striking, realistic imagery.

His two Elasmosauruses swimming through the water, captures the long necks, paddled limbs, and slender bodies of the species. Using current research, he highlights how they maintained a straightened posture and an out-stretched neck while hunting.

Together, these artists expand our growing collection of paleoart. Explore their work and many other illustrators and photographers covering prehistoric life, fossils, and more at ScienceSource.com.

Comment

Microscopic photo of Sickle cells, crescent-shaped erythrocytes (red blood cells) that result from a change in the amino acid sequence of the cells' hemoglobin. © Eye of Science / Science Source

Authentic Sickle Cell Disease Visual Content for Healthcare, Education, and Publishing

September 18, 2025

Understanding Sickle Cell Disease

Sickle cell disease (SCD) is one of the world's most common inherited blood disorders, affecting millions of people globally. In the United States, approximately 100,000 individuals live with the disease, with sickle cell disease occurring in about 1 in 365 Black or African American births. The condition is also prevalent in regions where malaria has historically been common, including sub-Saharan Africa, the Middle East, India, and parts of the Mediterranean.

Sickle Cell Patient in Clinic

A nurse connecting tubes to a SCD patient's arm for a red blood cell exchange. © Life in View/Science Source

Stock Image Preview

Caused by a genetic mutation in hemoglobin, sickle cell disease transforms normally flexible red blood cells into rigid, crescent-shaped cells that can block blood flow and reduce oxygen delivery throughout the body. These blockages can lead to severe pain crises, anemia, infections, organ damage, stroke, and other life-threatening complications.

Advances in Treatment and Research

Recent advances in treatment have transformed patient care. New medications, improved supportive therapies, stem cell transplantation, and emerging gene-editing approaches offer hope for improved outcomes and, in some cases, a potential cure. Yet many patients continue to face significant health challenges, disparities in care, and limited access to advanced treatments.

As researchers continue to explore innovative therapies, clear and accurate communication remains essential for patients, healthcare professionals, educators, and the public.

The Importance of Accurate Medical Visuals

Genetics of Sickle Cell Disease

Chromosome 11, a normal blood cell, and a sickle cell. © Monica Schroeder/Science Source

More Information

Sickle cell disease involves complex biological processes that can be difficult to explain through text alone. Authentic medical imagery helps audiences understand abnormal red blood cell morphology, vaso-occlusion, genetic inheritance, disease complications, diagnostic testing, and emerging treatments.

High quality visuals can improve engagement and comprehension in textbooks, patient education materials, healthcare marketing campaigns, pharmaceutical communications, news stories, and digital health platforms.

Authentic Sickle Cell Disease Content from Science Source

Science Source provides a comprehensive collection of authentic, expertly captioned medical stock photography, illustrations, micrographs, and medical imaging related to sickle cell disease. Our content is created by medical photographers, scientific illustrators, and healthcare professionals, not generated by AI, ensuring the accuracy and credibility required for professional healthcare and educational use.

Gallery of Sickle Cell Disease Images for Licensing

Whether you are developing educational resources, reporting on advances in gene therapy, creating patient-facing materials, or illustrating scientific publications, Science Source offers trusted visual content that helps audiences better understand this complex genetic disorder.

3D Illustration of Blood Clot

Sickle cells cannot move through small blood vessels causing blockages. © Tim Vernon/Science Source

Stock Image Preview

Link Between Sickle Cell and Strokes

Sickle cell patients are more prone to stroke. © Sue Seif/Science Source

View Stock Image
Comment

Psychology in Pictures

February 7, 2023

About fifty percent more people receive mental health treatment in the US today than twenty years ago. Psychiatric drug use has gradually increased since the 1980’s and the phrase ‘mental health’ has been used to solve problems as diverse as homicides and depression.

While its origins can be traced back to ancient times, modern psychology begins with Sigmund Freud attempting to understand the subconscious with his famous concepts of the id, ego and superego.

Psychology stock image and video gallery

Following him, Jean Piaget created his own stages of human development and discovered the milestone of object permanence among young children. Pavlov began behaviorism with his famous experiments with dogs.

The'“midlife crisis” appeared first in Carl Jung’s theory of archetypes connecting human experience with ideal structures called archetypes present in the myths of cultures all around the world.

With the rise of modern medicine, psychiatric drugs became widely used in the 20th century. Today 1 in 6 Americans use drugs to treat mental disorders ranging from ADD to bipolar disorder. Anti-depressant use has increased, showing some effectiveness among people with severe depression. Other patients may be affected by the “placebo effect” or the belief that something is working when it is not, adding yet another feature to the world of psychology.

As the study of the mind grows, photographers and illustrators are coming up with new ways of representing it with images. Science Source is a worldwide provider of scientific images, offering the latest in science images. For Pavlov’s dogs, Rorschach tests, Campos’ Visual cliff, and many more psychology images, click on the link below.

Psychology photo gallery

Comment
medical illustration of neurons showing myasthenia gravis

A medical illustration comparing normal neuron activity with a neuron affected by Myasthenia Gravis.

Myasthenia Gravis, an Autoimmune Disease

June 11, 2022

Myasthenia Gravis is a rare disease - fewer than 200,000 cases per year in the United States.

GALLERY OF MEDICAL ILLUSTRATIONS OF MYASTHENIA GRAVIS

It is one of the numerous autoimmune diseases. There is no cure, but medications or surgery may help with the condition. The symptoms may last a year or a lifetime.

Visually obvious symptoms are a partial or full paralysis of the face. usually on one side. Droopy eyelids, lack of control of the eye, drooping mouth and lips. Additional common symptoms include weakness of arm or leg muscles, double vision, and difficulties with speech, chewing, swallowing, and breathing.

The cause is a malfunction of the nervous system. Often antibodies block the proper communication in the nervous system.

Experts believe the thymus gland is the source of these antibodies. People with Myasthenia gravis often have an enlarged thymus gland. Fatigue, stress, illness, surgery, and other factors play a role in the onset of symptoms.

In severe cases, the person may need assistance eating or breathing. If detected early, most people can regain enough strength to lead normal or almost normal lives.

Comment

A person with the Monkeypox rash and an electron micrograph of the virus.

Monkeypox Now in the United States, the UK and Europe

May 20, 2022

The world is just beginning to feel the Coronavirus pandemic loosen it grip when we have a new disease to be concerned with: Monkeypox.

What is Monkeypox? It is a viral infection - related to smallpox - that was first noticed in 1958 in research monkeys. The Democratic Republic of Congo recorded the first human case in 1970.

GALLERY OF MONKEYPOX STOCK PHOTOS AVAILABLE TO LICENSE

Up until now, only cases appeared in people in or who had traveled from the DRC. who had traveled to the DRC. Now in May of 2022, new cases are coming to light - in people that have no connection to international travel.

In the past human to human transmission was extremely rare. The disease causes a skin rash with multiple large oozing blisters. Transmission could occur with the contact of the body fluids or linens contaminated with these fluids.

Animal transmission could occur through a bite, scratch or eating bush meat.

Scientists are now investigating whether the recent infections were transmitted from one human to another via sexual activity.

On the positive side, there is already a vaccine that is currently available to people who are at high risk of exposure, such as medical workers. And like the Coronavirus the best ways to prevent infection are to avoid contact with an infected person, infected animals, or any materials handled by an infected person or animal.

And wash your hands!

Comment
Older Posts →

Science Source® provides authentic, high-quality photography, illustration, and video focused on healthcare, biomedicine, technology, the physical sciences, and the natural and life sciences.

BLOG RSS

Discover Science Art, Apparel & Unique Gifts

  • 2026
    • Jul 8, 2026 COVID-19 and Cardiovascular Risk
    • Jun 30, 2026 Chemistry Experiment Images That Teach Science Well
    • Jun 23, 2026 Eczema: The Itch That Rewrites Daily Life and the Images That Tell Its Story
    • Jun 19, 2026 A Comprehensive Resource for Psoriasis Visuals
    • Jun 16, 2026 Visualizing Fragile X Syndrome
    • Jun 10, 2026 Grace Hopper and the First Computer Bug: A Legendary Legacy
    • Apr 7, 2026 CAR T-Cell Therapy: Engineering the Immune System to Fight Cancer
    • Mar 20, 2026 How Marie Curie Saved Lives, Women's History Month
    • Feb 26, 2026 The Vagus Nerve: Hype, Science, and Clinical Reality
  • 2025
    • Dec 30, 2025 The Cycles of Life, Science, and Nature
    • Oct 22, 2025 The Science of the Measles
    • Sep 26, 2025 New Paleoartists Bring the Prehistoric World to Life: Simone Zoccante, Mohamad Haghani and Gustavo Higón
    • Sep 18, 2025 Authentic Sickle Cell Disease Visual Content for Healthcare, Education, and Publishing
  • 2023
    • Feb 7, 2023 Psychology in Pictures
  • 2022
    • Jun 11, 2022 Myasthenia Gravis, an Autoimmune Disease
    • May 20, 2022 Monkeypox Now in the United States, the UK and Europe
    • Mar 16, 2022 The Curious Case of Phineas Gage
    • Mar 10, 2022 Mitosis Cell Division: Amazing Stock Science Footage
    • Feb 10, 2022 The Most Famous Solvay Conference on Physics
    • Feb 3, 2022 American Heart Month: How the Heart Works
    • Jan 27, 2022 Isaac Newton and Understanding Color
    • Jan 19, 2022 MLK day and African American History Footage
  • 2021
    • Nov 9, 2021 Microscope Photos (SEMS) Make Unique Gifts for the Science Minded
    • Nov 7, 2021 Cajal, the Father of Modern Neuroscience - Great Gift Idea For Nerds & Scientists
    • Nov 1, 2021 Diversity in Health, Work, and Educational Stock Photos
    • Sep 21, 2021 Spark Imagination With Conceptual Images
    • Aug 24, 2021 You Are Never Alone When Follicle and Eyelash Mites Live on Your Face
    • Jul 14, 2021 Space Travel: Then and Now
    • Jun 29, 2021 Mosquitos and Dengue Fever
    • Jun 14, 2021 How to Live Forever: Rotifers, Nematodes and Tardigrades
    • Feb 19, 2021 Gifts for Lovers of Classical Music
    • Jan 29, 2021 The Real Pocahontas
    • Jan 20, 2021 Blackbeard and Other Swashbuckling Pirates
    • Jan 13, 2021 Super Earths and Exoplanets
  • 2020
    • Dec 21, 2020 The History of Christmas
    • Dec 19, 2020 The Importance of Protein Folding
    • Dec 9, 2020 Types of Vaccines: Whole Pathogen, Subunit, and Nucleic Acid (mRNA & DNA)
    • Dec 7, 2020 History of Prosthetics: From Ancient Egypt to Today
    • Nov 16, 2020 Down Syndrome Awareness
    • Oct 13, 2020 Public Health: Then and Now
    • Sep 18, 2020 Neurogenetics
    • Aug 11, 2020 Flower Micrographs: RF & RM Images
    • Jul 6, 2020 Taking a Closer Look at Microscopy for Medical and Scientific Use
    • Jun 3, 2020 The Industrial Revolution: Then and Now
    • Jun 2, 2020 They're Not All Bad: Good Viruses and Bad Bacteria
    • May 19, 2020 Watch Science Come Alive Through Chemistry!
    • May 19, 2020 A Vaccine Rumor... That Was True
    • Apr 23, 2020 Medical Micrographs: a View into the Human Body
    • Apr 21, 2020 Earth Day and Nature Conservation
    • Feb 12, 2020 Bringing to Light, Creatures of Darkness: Cave and Deep Sea Photography of Dante Fenolio
    • Jan 29, 2020 Coronavirus, the Flu and Pandemics
  • 2019
    • Nov 11, 2019 Voyager 1 at a New Frontier
    • Oct 28, 2019 Rising Sea Levels
    • Sep 25, 2019 Plastic is Deadly
    • Jun 25, 2019 Endangered Animals
    • Jun 18, 2019 Immunotherapy: Your Immune System is Cancer's Biggest Enemy
    • Jun 11, 2019 Origins of Modern Chemistry
    • May 28, 2019 History of Flight: From Kites to Space Travel.
    • May 21, 2019 Vaccines: How They Protect Us
    • May 14, 2019 Concussions and the Future of Contact Sports
    • Apr 17, 2019 NASA and the Space Age
    • Apr 9, 2019 Don't Sweat It: How Mosquitos Find Us
    • Mar 18, 2019 The Link Between Gum Disease and Alzheimer's
    • Mar 13, 2019 The Women of Coding
    • Mar 5, 2019 Climate Change, Extreme Weather and the Jet Stream
    • Feb 26, 2019 What You Need to Know About Crohn's Disease and Ulcerative Colitis
    • Feb 6, 2019 The Dead Do Tell Tales
    • Feb 1, 2019 Black History Month Started as Negro History Week
    • Jan 28, 2019 Alchemy and the Road to Science
    • Jan 14, 2019 Around the World in 118 Elements
  • 2018
    • Nov 28, 2018 How the Stars Got Their Colors
    • Nov 5, 2018 One Hundred Years of the Flu Virus
    • Oct 26, 2018 The Quirky Beginning of Biomedical Research, with Royalty Free Images
    • Oct 22, 2018 Molecular Models
    • Oct 19, 2018 Acute Flaccid Myelitis, a Growing Concern for Parents
    • Oct 15, 2018 The Beautiful Creepy Crawly World of Francesco Tomasinelli
    • Oct 8, 2018 Explore the Human Microbiome
    • Oct 3, 2018 The Natural History Collection
    • Sep 18, 2018 Ovarian Cancer: A Ghostly Disease
    • Sep 10, 2018 The Aliens are Here: Invasive Species
    • Aug 10, 2018 Retro Animals
    • Aug 6, 2018 Wild Weather & Climate Change
    • Jul 30, 2018 Phytoplankton & CO2
    • Jul 23, 2018 Exploding Videos
    • Jul 16, 2018 The Free Will Debate
    • Jul 9, 2018 Summertime: Rising Both Temperatures and Skin Cancer Concerns
    • Jun 25, 2018 Exercise for Life
    • Jun 25, 2018 Good Ole' Summer Time Fun
    • Jun 22, 2018 David Scharf Scanning Electron Microscopy
    • Jun 18, 2018 The Great Barrier Reef In Peril
    • Jun 8, 2018 AI – The Mind of the Future
    • Jun 7, 2018 Mimicry in Nature
    • Jun 4, 2018 Alzheimer's Disease, a Tragic Future for Our Aging Population
    • May 31, 2018 Lower Back Pain? You're in Good Company
    • May 31, 2018 Feathered Dinosaurs
    • May 25, 2018 Biometrics: Never Need a Password Again
    • May 25, 2018 Plastic: A Global Crisis
    • May 14, 2018 Beauty From the Center of the Earth
    • May 12, 2018 Volcanic Eruptions: Kilauea and Beyond
    • May 11, 2018 Life on Other Planets
    • May 11, 2018 Invincible Water Bears
    • May 10, 2018 Hepatitis C and The Miracle of Modern Medicine
    • May 3, 2018 Springtime Is Baby Animal Time
    • May 3, 2018 Ticks, Mosquitos and Fleas. Oh My.
    • Apr 27, 2018 The First College Graduate
    • Apr 26, 2018 Deep Sea Exploration
    • Apr 26, 2018 Aquatic Living
    • Apr 23, 2018 The Heartbreak of Psoriatic Arthritis, Seriously
    • Apr 19, 2018 Earth Day: Plastic in Our Waterways
    • Apr 18, 2018 The Robotic Age
    • Apr 18, 2018 Book a Vacation to the Moon
    • Apr 17, 2018 Immunotherapy: A Possible Cure for Lung Cancer?
    • Apr 12, 2018 Fractals: Neverending Geometric Shapes
    • Apr 12, 2018 Marijuana in the Modern Age
    • Apr 6, 2018 Alternative Medicine: Quackery or Cure?
    • Apr 6, 2018 The Unbreakable Bond Between People & Bees
    • Apr 6, 2018 Hanami and Sakura Matsuri
    • Mar 30, 2018 A Tragic Family of Diseases: Neurodegenerative Disease
    • Mar 30, 2018 Stephen Hawking – A Brief History
    • Mar 23, 2018 Step Out into the Wild!
    • Mar 22, 2018 The Invention of Climate Change

To request custom illustration or photography, call 212-758-3420 or email
Science Source Images & Video Home   Join our mailing list FINE ART AMERICA GIFT SHOP

Science Source documents science — it does not practice it. Written content is for publishing and communications professionals. Nothing here constitutes medical advice. Readers with health concerns should consult a qualified medical professional.

All Contents © Science Source Stock Images and Video
405 Lexington Avenue, Floor 9, New York, NY, 10174